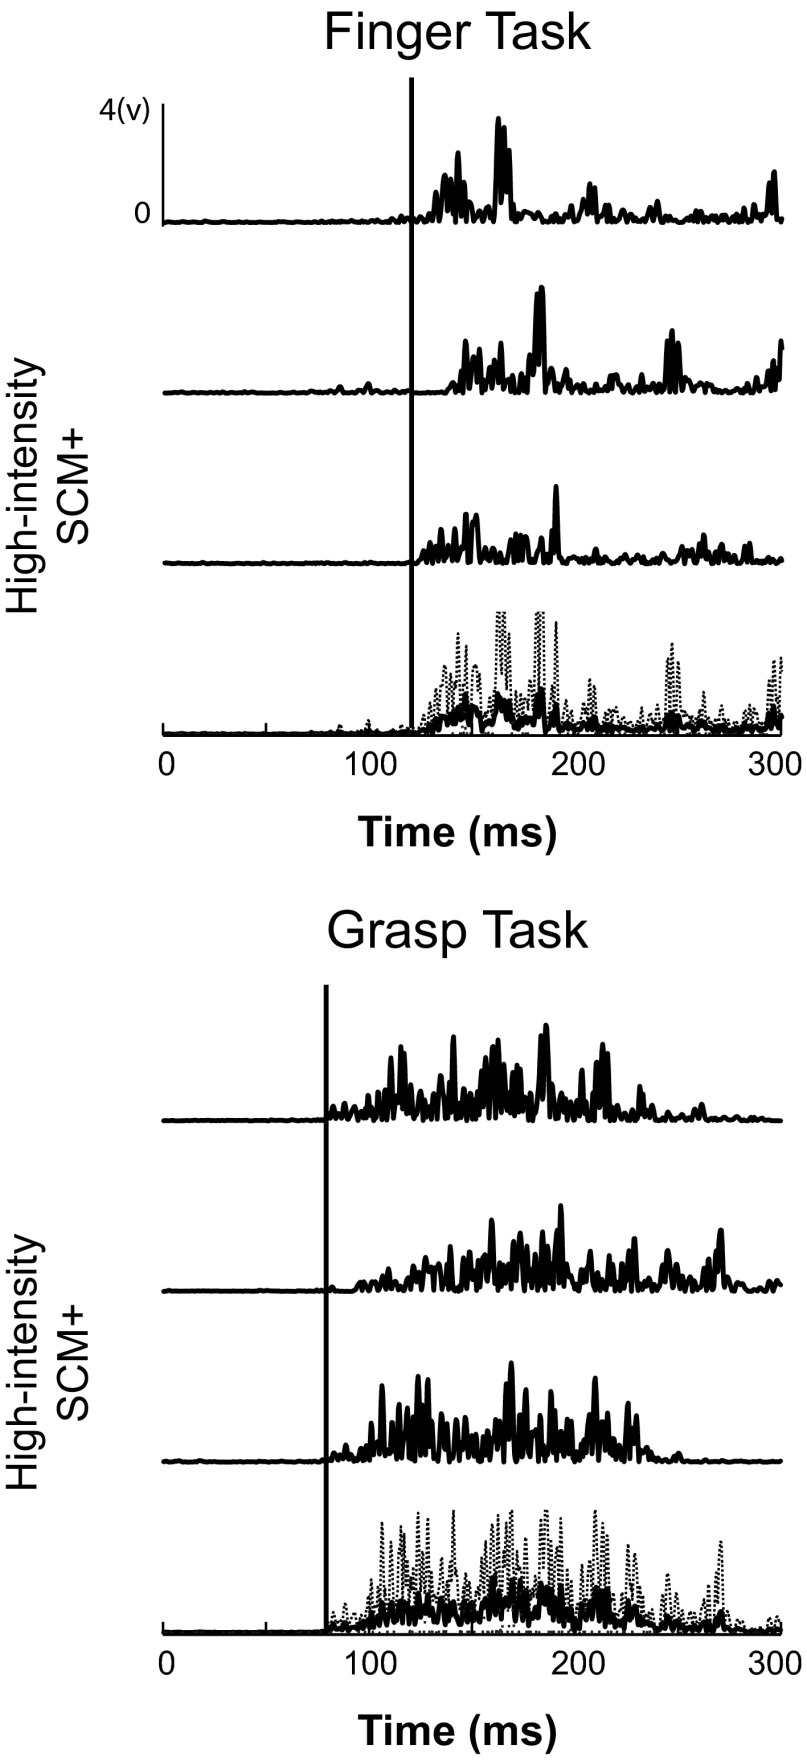
Fig. 5.
Individual and average HI SCM+ trials during Finger and Grasp tasks. Three raw HI SCM+ trials during the Finger task (top) are shown above the average (solid) and standard deviation (dashed) of all traces. Same responses during the Grasp task (bottom) are shown. Solid black lines represent the start of the average response.

