Fig. 3.
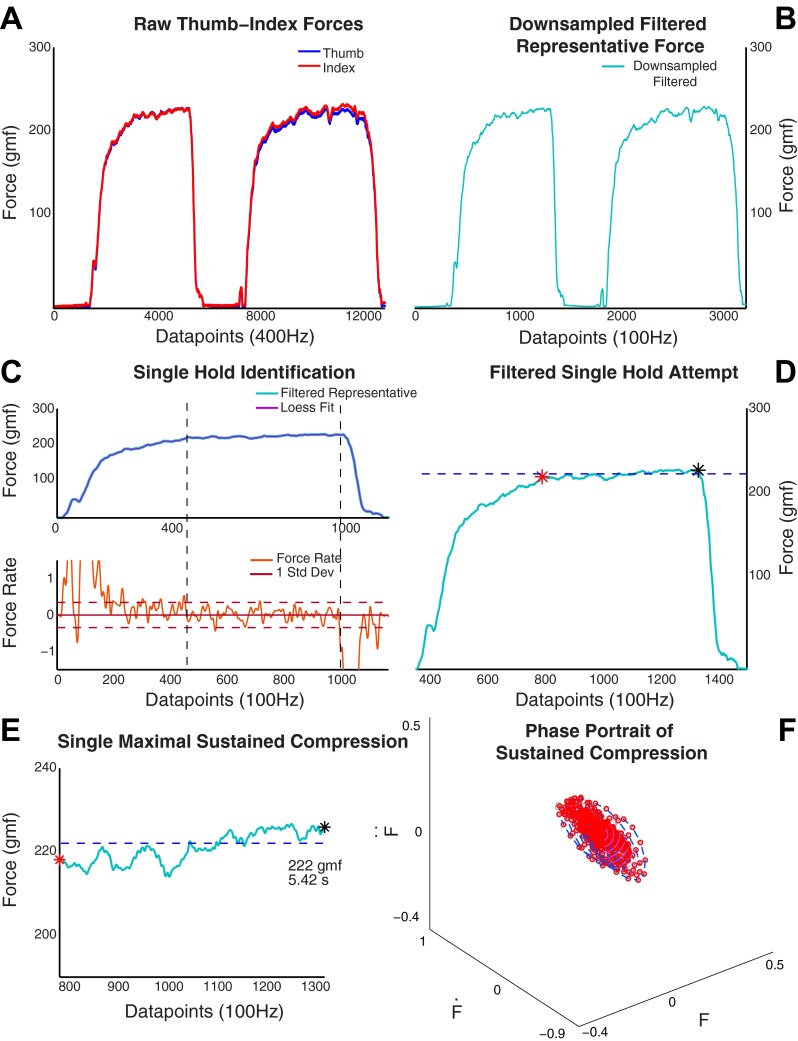
Data processing. A: an illustrative example of the force traces measured shows the forces from both the thumb and index finger at 400 Hz. Note that in a dynamical situation the index finger and thumb forces will not be equal and opposite at all times. A mean of the 2 forces at each time point was used to create a representative force. gmf, Gram force. B: this representative force was downsampled to 100 Hz and filtered at 25 Hz with a 2nd-order Butterworth filter. For each of the hold attempts (2 are seen in A and B) a loess filter was applied to the representative force and a force derivative was computed. C: both the force magnitude (top) and the force derivative (bottom) were used for identification of the start and end of the maximal sustained compression force. D and E: the single hold attempt and its mean are seen in its location in the time trace (D), and a magnified version (E) shows the force trace and its mean during the 5 s the maximal sustained compression force was maintained. F: the maximal sustained compression force was converted into a phase portrait (see Fig. 6) to quantify the amount of dispersion during the sustained compression period. F, Ḟ, F̈, force and its first 2 derivatives.

