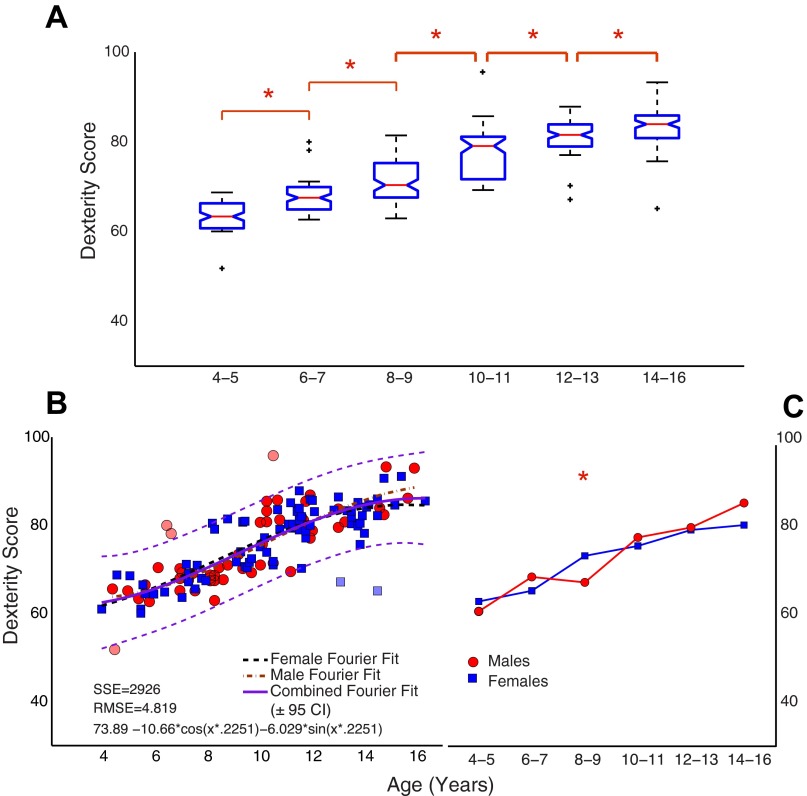
Fig. 5.
Normalized dexterity score throughout childhood and adolescence. The dexterity score was computed as a weighted average based on the mean hold force on the test spring and normalized to the maximal possible value (see Eq. 1). A: boxplots show changes across the age range. B: a regression line (±95% prediction bounds) based on a Fourier robust fit is shown in green/magenta, respectively. Outliers have been indicated in both A (as +) and B (as lighter-shaded data points). Data in B are colored by sex (blue, girls; red, boys), and individual regression lines are shown for each. Significant differences, indicated by asterisks based on P < 0.05, are seen in adjacent age bins across childhood and adolescence (A). The interaction between age and sex is shown in C along with significant age bins. SSE, sum of squared residuals; RMSE, root mean squared error; CI, confidence interval.

