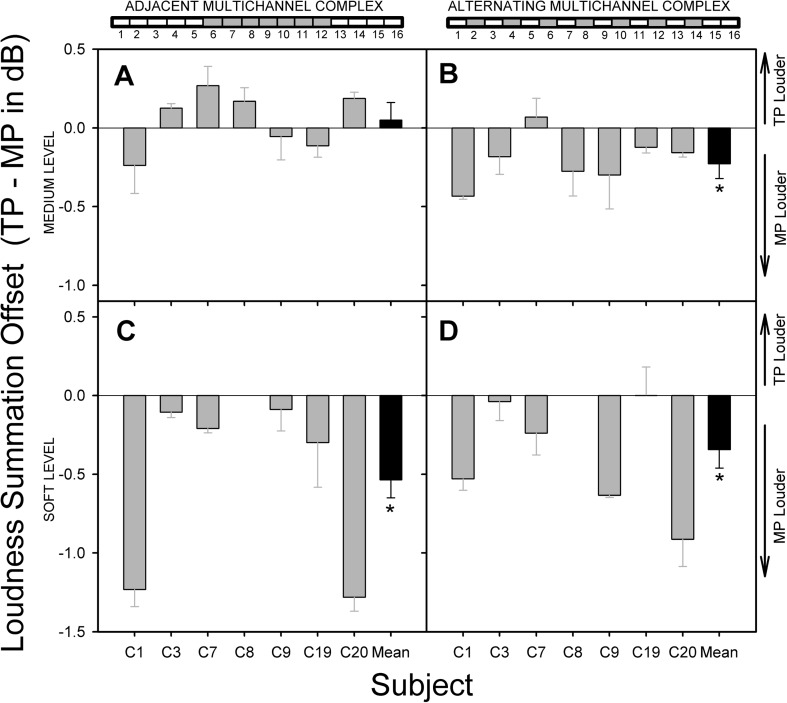
Figure 1.
Bar plots show average loudness summation offset (from three repetitions) in dB, along with the standard error for each subject tested (gray bars). The mean offset for all subjects is shown as the last bar (black) of the bar plots for each multichannel complex. Results are shown for a medium loudness level: (a) results for the adjacent multichannel complex; (b) results for the alternating multichannel complex. Average loudness summation offset at a soft loudness level: (c) results for the adjacent multichannel complex; (d) results for the alternating multichannel complex. Asterisks denote significant results.

