Figure 3.

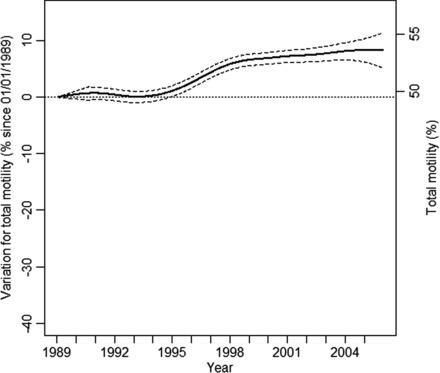
Variation in percent for total motility since 1 January 1989 for a 35-year-old man in metropolitan France with 95% confidence intervals (left axis). Projected values in percentage motile spermatozoa (right axis).

Variation in percent for total motility since 1 January 1989 for a 35-year-old man in metropolitan France with 95% confidence intervals (left axis). Projected values in percentage motile spermatozoa (right axis).