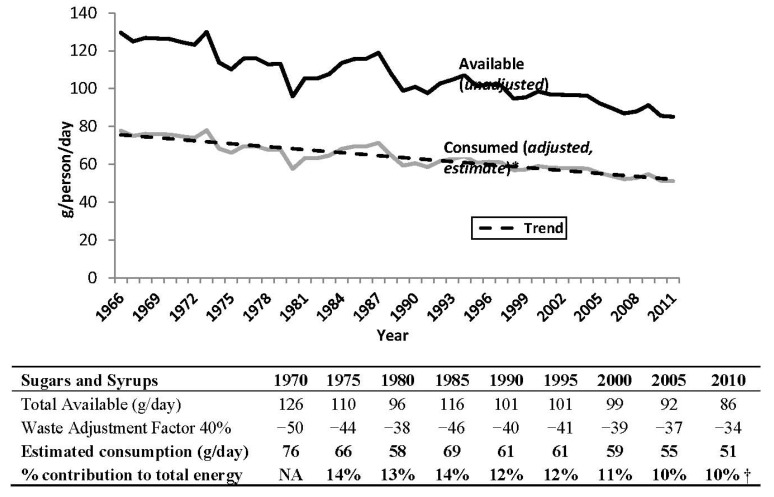
Figure 2.
Sugars and syrups available for consumption (unadjusted availability data) and apparent consumption (adjusted availability data) in Canada from 1966 to 2011. Source: Statistics Canada (2012). * Experimental data, use with caution. Availability data have been adjusted for retail, household, cooking and plate loss using a 40% waste adjustment factor to calculate apparent consumption (consumed estimate) [2,11]. Data includes sugar, honey and maple sugars, and excludes corn sweeteners (i.e., high fructose corn syrup (glucose-fructose), glucose syrup, and dextrose); high fructose corn syrup was introduced in the 1970s and has been the primary sweetener in soft drinks in Canada since the late 1990s. † Energy availability data was discontinued in 2009; value of 10% is an average of the last available five years (2005–2009).

