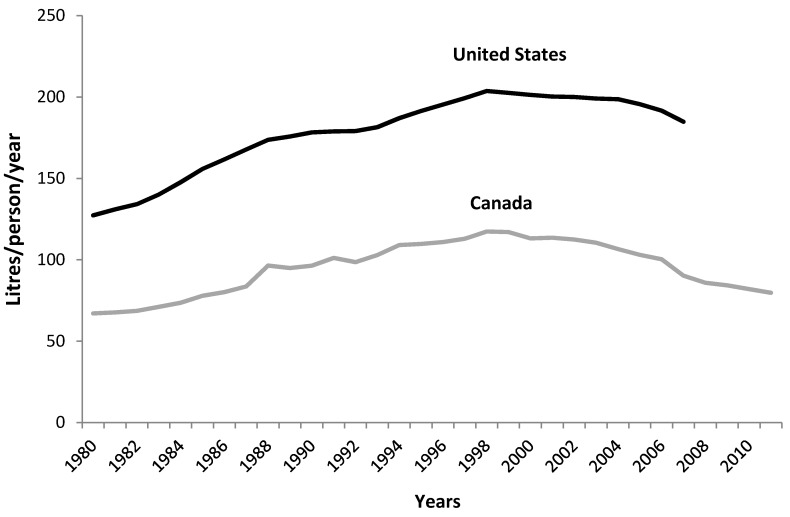
Figure 3.
Soft drinks available for consumption (unadjusted) per capita from 1980 to 2011 in Canada and the United States. Canadian soft drink availability data includes both caloric and non-caloric soft drinks. For comparison, US data also includes both caloric and non-caloric soft drinks. Canadian diet drink share is not available; however, US share was 31% in 2007. Sources: Statistics Canada (2012) and United States Department of Agriculture (USDA) (2007). USDA soft drink data was discontinued in 2007.

