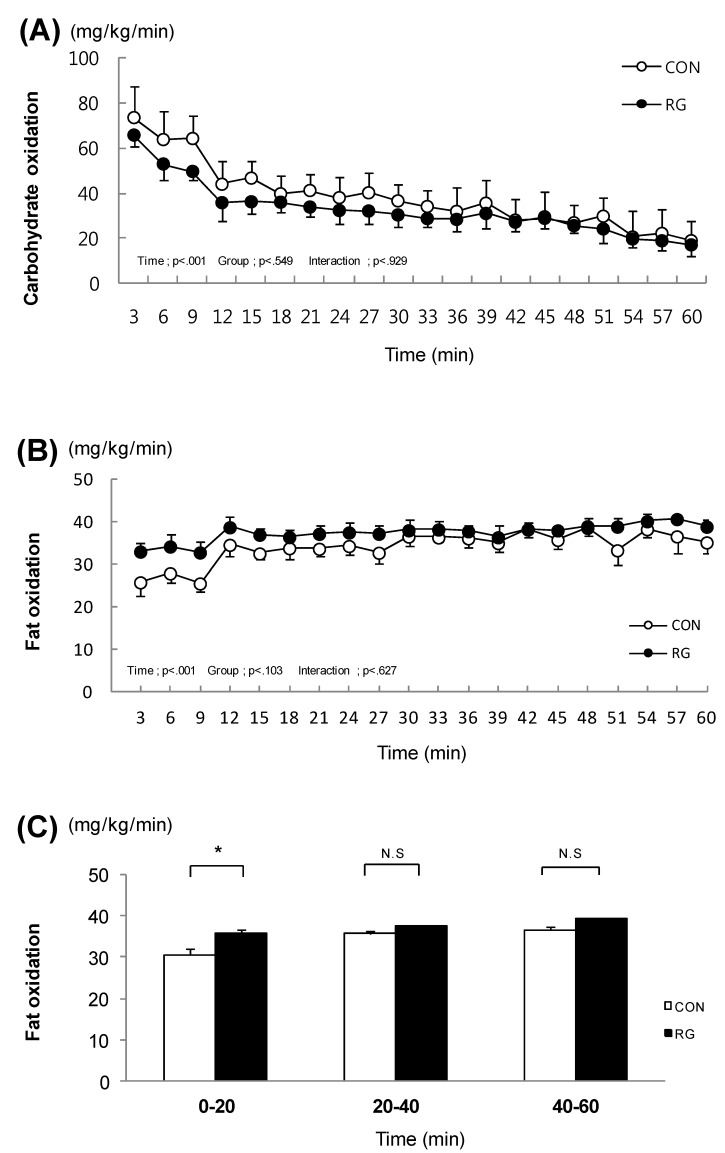
Figure 1.
The change in carbohydrate oxidation and fat oxidation during exercise for 1 h. (A). The change in carbohydrate oxidation during exercise for 1 h; (B). The change in fat oxidation during exercise for 1 h; (C). Fat oxidation at every 20 min. Values are presented as means ± standard error (n = 21). * vs. CON p < 0.05; CON: no treatment with training, RG: RG treatment with training.

