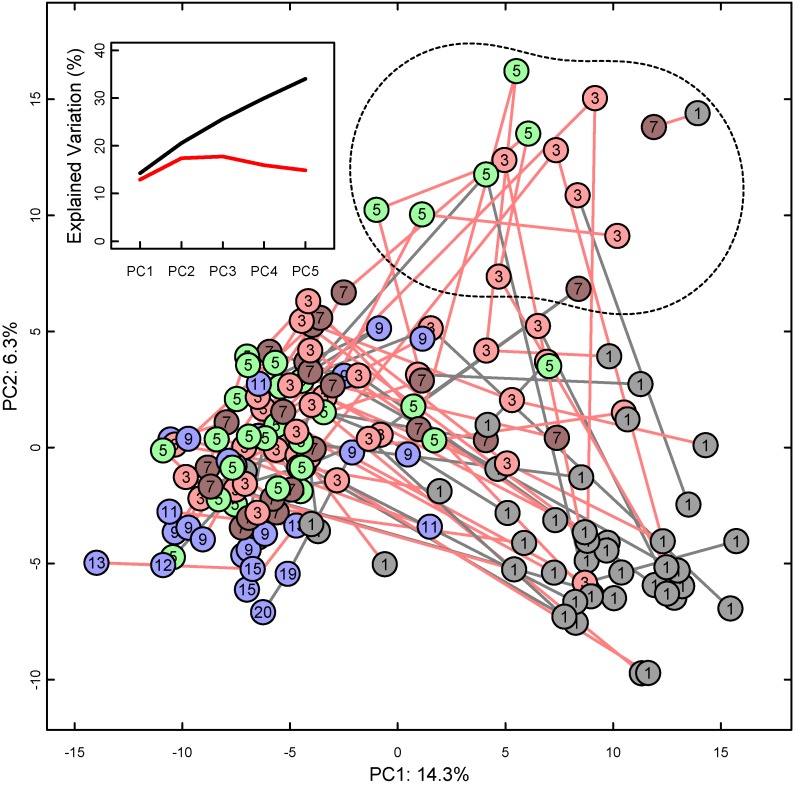
Figure 3.
PCA score plot of NMR spectra of all available urine samples, presented as points marked with infant age in weeks and color-coded as earlier. PCA: Principal component analysis, NMR: Nuclear magnetic resonance, PC: Principal component with percent of explained total variation. Lines connect consecutive samples from one infant; line color red for intervention, gray for control group. Outlier samples marked with a dashed line in the upper right quadrant. Inset: Cumulative explained variation (black) and cross-validation (red) of the first five PCs.

