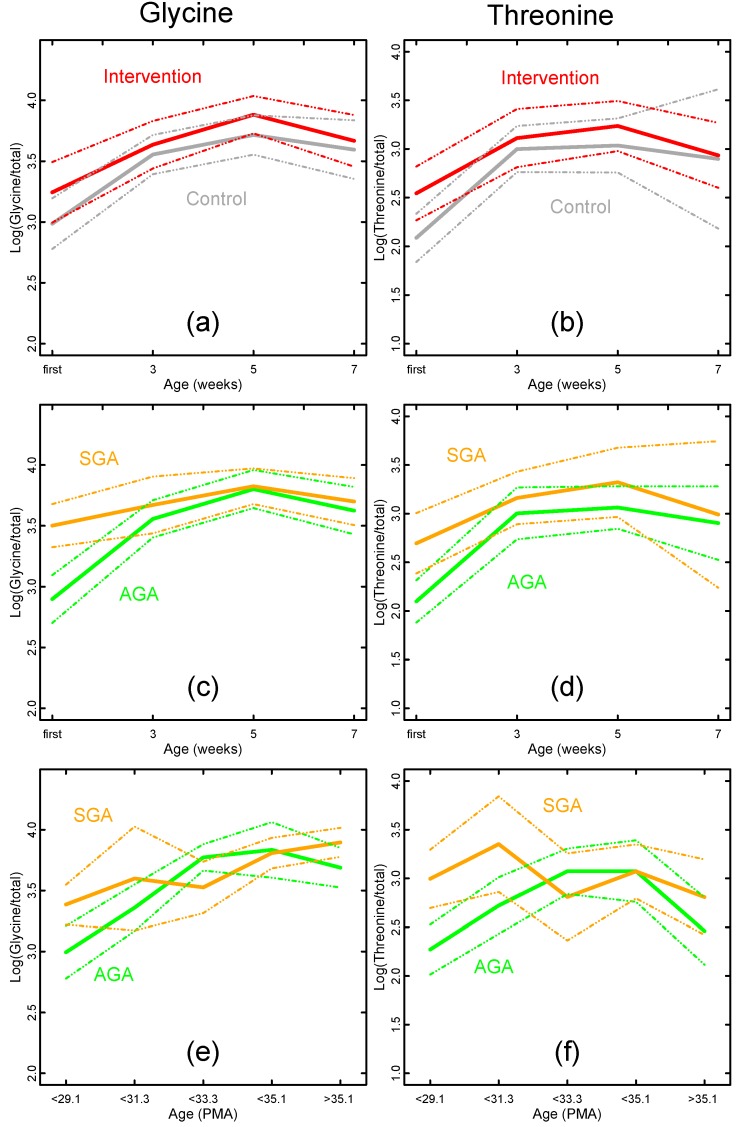
Figure 4.
Temporal development of glycine and threonine log-pseudo-concentrations (means and 95% CIs) related to nutritional intervention, SGA status and age. (a) Glycine levels by nutritional intervention (intervention red, control gray); (c) Glycine levels by SGA status (SGA orange, AGA green) for samples from weeks 1, 3, 5 and 7; (e) As above, but samples selected by PMA instead of weeks of life; (b, d, f) Corresponding figures for threonine.

