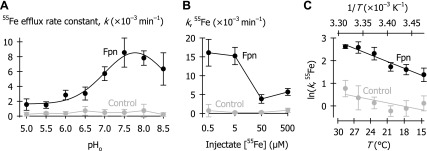
Fig. 6.

Functional characteristics of Fpn-mediated 55Fe efflux. A: first-order rate constants (k) of 55Fe efflux as a function of extracellular pH (pHo) in control oocytes (gray) and oocytes expressing Fpn-EGFP (black) injected with 50 nl of 500 μM 55Fe (n = 10–16 per group). Two-way ANOVA revealed an interaction (P < 0.001). Data for oocytes expressing Fpn were fit by a 4-parameter Gaussian function (Eq. 2) in which a = (6.9 ± 0.5) × 10−3 min−1, b = 0.8 ± 0.1, pHoptm = 7.8 ± 0.1, and kmin = (1.6 ± 0.4) × 10−3 min−1 (r2 = 0.98, P < 0.001). B: 55Fe efflux rate constants (k) in control oocytes (gray) and oocytes expressing Fpn-EGFP (black) as a function of injectate 55Fe concentration (n = 10–15 per group). Two-way ANOVA revealed an interaction (P < 0.001); Fpn differed from control at every concentration (P < 0.001). Within Fpn, all concentrations differed from one another (P ≤ 0.003) except 0.5 cf. 5 μM (P = 0.18). C: 55Fe efflux rate constants (k) as a function of temperature (T) in control oocytes (gray) and oocytes expressing Fpn-EGFP (black) (injectate [55Fe] = 5 μM) (n = 10–12 per group). Data were fit by Eq. 3 for Fpn: activation energy (Ea) = 17.3 ± 1.1 kcal/mol, lnA = 31.5 ± 1.9 (r2 = 0.79, P < 0.001, n = 67); and control: Ea = 8.4 ± 1.8 kcal/mol, lnA = 14.5 ± 3.1 (r2 = 0.25, P < 0.001, n = 67). Ea differed between Fpn-EGFP and control (P < 0.001).
