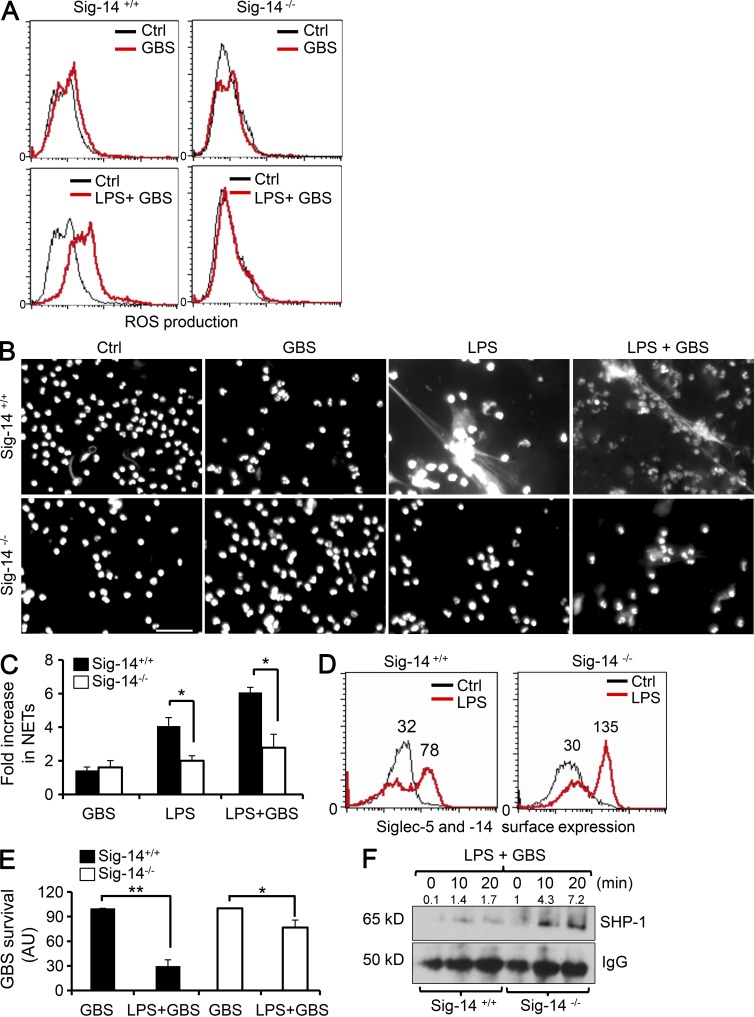
Figure 4.
TLR priming increases GBS suppression of Sig-14−/− but not Sig-14+/+ neutrophil responses. (A) Human neutrophils of the indicated genotypes were left unstimulated or stimulated with LPS for 6 h, incubated with H2DFCA for 30 min, and then infected with GBS (MOI = 10); ROS production was measured 20 min after infection by FACS. The histogram shows fluorescence of ROS indicator H2DCFDA. (B) Human neutrophils of the indicated genotypes were left unstimulated or stimulated with LPS for 6 h and infected with GBS (MOI = 10), and NET formation was visualized by myeloperoxidase and DAPI staining 30 min after infection. Bar, 50 µm. (C) Quantification of NETs shown in B. (D) Human neutrophils of the indicated genotypes were left unstimulated or stimulated with LPS for 8 h; expression of Siglec-5 and Siglec-14 was analyzed by FACS using antibody recognizing both human Siglec-5 and Siglec-14. The histogram depicts combined surface expression of Siglec-5 and Siglec-14. (E) Human neutrophils of the indicated genotypes were stimulated or not with LPS for 6 h and infected with GBS (MOI = 10), and bacterial killing was assayed 20 min after infection. (F) Human neutrophils of the indicated genotypes were stimulated with LPS for 6 h and infected with GBS (MOI = 10), and cell lysates prepared at the indicated times were immunoprecipitated with Siglec-5– and Siglec-14–recognizing antibody. SHP-1 recruitment and total IgG were analyzed by immunoblot. The SHP-1/IgG (×10) densitometry value is shown on the immunoblot. Data in this figure are representative of two to four independent experiments with one to three different donors per genotype in each experiment. Results are means ± SD; *, P < 0.05, **, P < 0.01.

