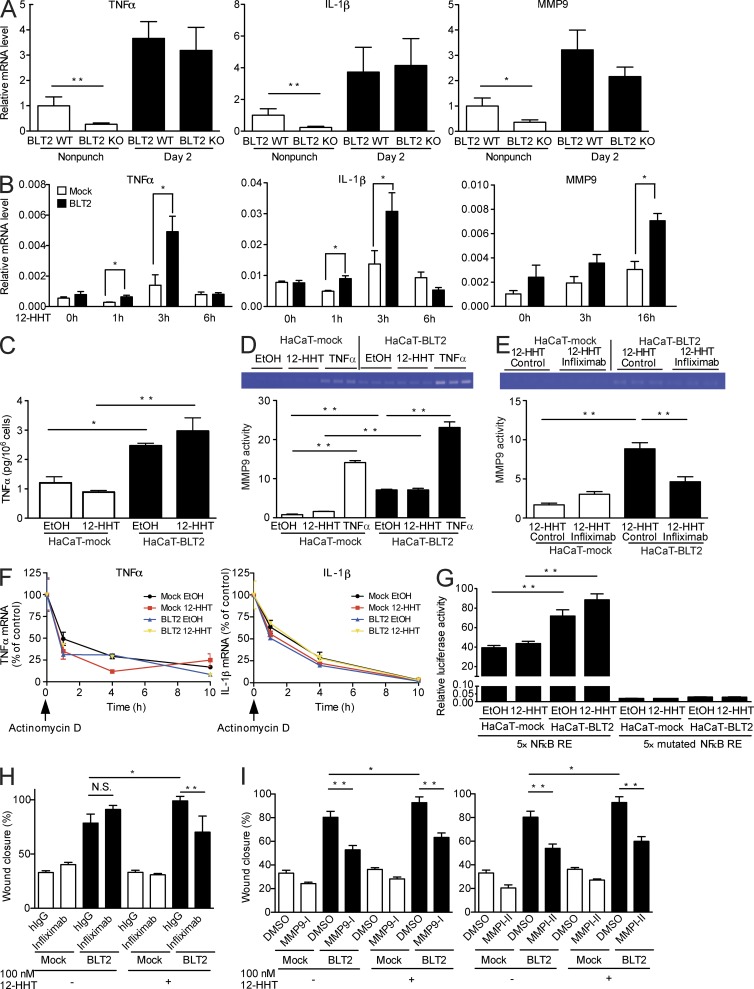
Figure 7.
TNF and MMP9 participate in 12-HHT/BLT2–dependent HaCaT cell migration. (A) Relative levels of TNF, IL-1β, and MMP9 mRNA were measured by Q-PCR in BLT2 WT and BLT2 KO mouse skin (n = 3–7 mice per group). Punch biopsies (5 mm in diameter) were obtained at 2 d after skin punching and used for the assay. The relative mRNA level in uninjured BLT2 WT mice was set as 1. (B) HaCaT-mock and HaCaT-BLT2 cells were stimulated with 1 µM 12-HHT, and the relative levels of TNF, IL-1β, and MMP9 mRNA were measured by Q-PCR (n = 3 experimental replicates). (C) HaCaT-mock and HaCaT-BLT2 cells were stimulated with EtOH vehicle or 1 µM 12-HHT for 6 h, and TNF protein levels were assessed in the culture medium (n = 3 experimental replicates). (D and E) MMP9 activity in the culture medium was measured by zymography. HaCaT-mock and HaCaT-BLT2 cells were serum-starved for 3 h and then stimulated for 24 h with EtOH vehicle, 1 µM 12-HHT, or 10 ng/ml TNF (D, n = 3 experimental replicates), or with 1 µM 12-HHT and 100 µg/ml control IgG or 100 µg/ml Infliximab (E, n = 3 experimental replicates). (F) Determination of TNF and IL-1β mRNA stability in HaCaT-mock and HaCaT-BLT2 cells. The cells were cultured in medium containing 5 µg/ml actinomycin d and EtOH vehicle or 1 µM 12-HHT and then harvested at the indicated times. TNF and IL-1β mRNA levels were quantified by Q-PCR (n = 3 experimental replicates). (G) Determination of NF-κB activity in HaCaT-mock and HaCaT-BLT2 cells. Cells were stimulated with EtOH vehicle or 1 µM 12-HHT, and subjected to the dual luciferase assay (n = 3 experimental replicates). (H and I) Quantification of cell migration of HaCaT-mock and HaCaT-BLT2 cells at 15 h after scratching. Cells were cultured in serum-free medium without 12-HHT or with 100 nM 12-HHT, and control IgG or 100 µg/ml Infliximab (H, n = 5–8 experimental replicates); or DMSO and 10 µM MMP9 inhibitor I (I, left, n = 6–8 experimental replicates) or 10 µM MMP inhibitor II (I, right, n = 6–10 experimental replicates). Data represent the mean ± SEM. **, P < 0.01; *, P < 0.05 (A and B, unpaired Student’s t test; C–E and G–I, two-way ANOVA with Bonferroni post hoc tests). All the results are representative of at least two independent experiments.

