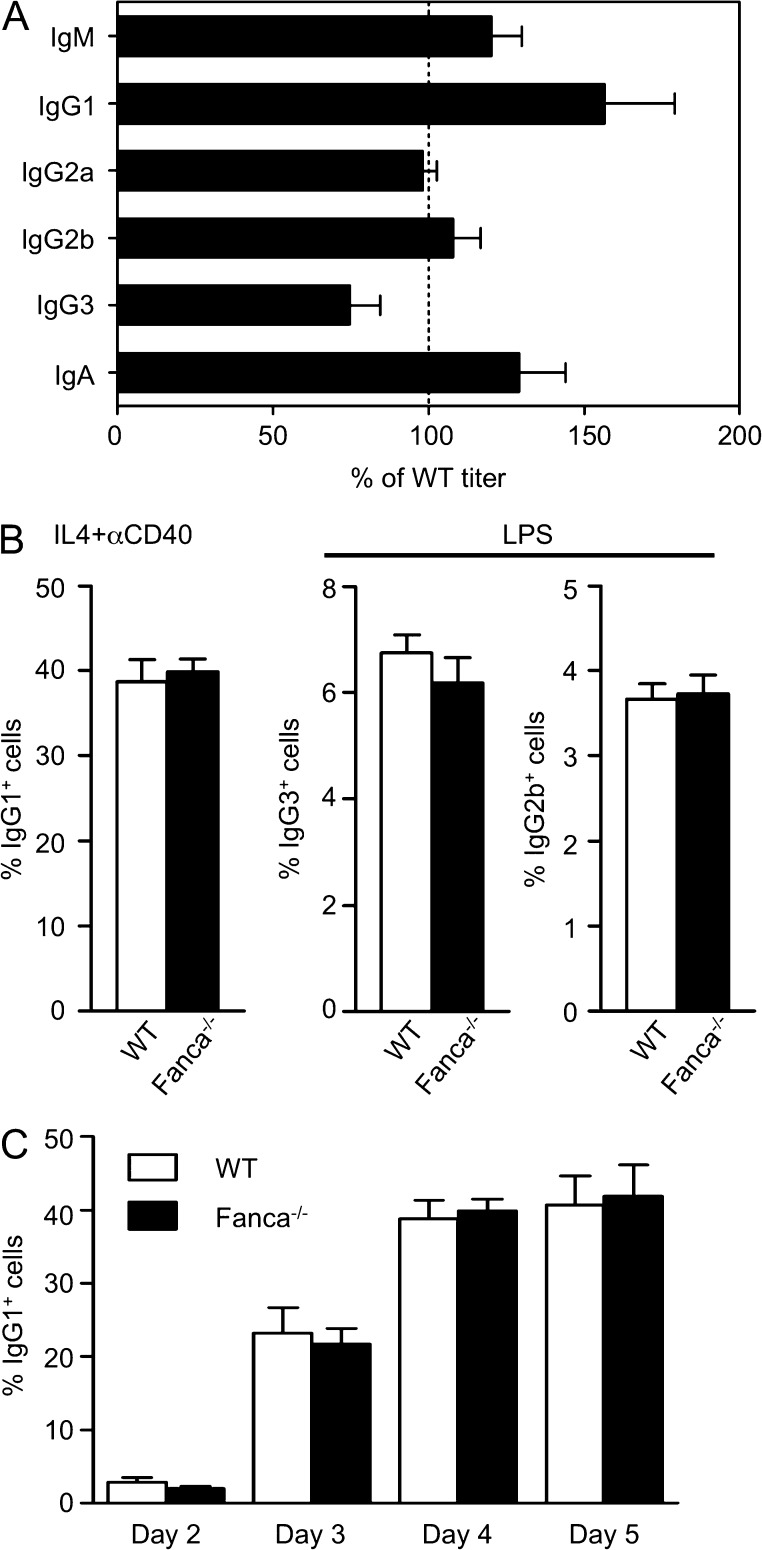
Figure 2.
Robust CSR in Fanca−/− mice. (A) Serum from Fanca−/− (n = 5) and WT mice (n = 7) was collected and analyzed by ELISA for the indicated IgM, IgG subclasses, and IgA. The results are displayed as mean ± SEM values for the Fanca−/− titer as a percentage of WT. Data are representative of two independent experiments with at least five mice per group. (B) Splenic B cells were isolated from Fanca−/− and WT mice and stimulated in vitro with IL-4 and anti-CD40 or LPS. The expression of IgG1, IgG3, and IgG2b was determined 4 d later by flow cytometry. Bar graphs show the mean percentages of cells expressing the indicated IgG ± SEM. Data are representative of three independent experiments with at least three mice per group. (C) Splenic B cells were isolated from Fanca−/− and WT mice and stimulated in vitro with IL-4 and anti-CD40. Surface IgG1 expression was determined by flow cytometry on days 2, 3, 4, and 5 after stimulation. Bar graphs show the mean percentages of IgG1+ cells ± SEM. Data are representative of five independent experiments with at least five mice per group.

