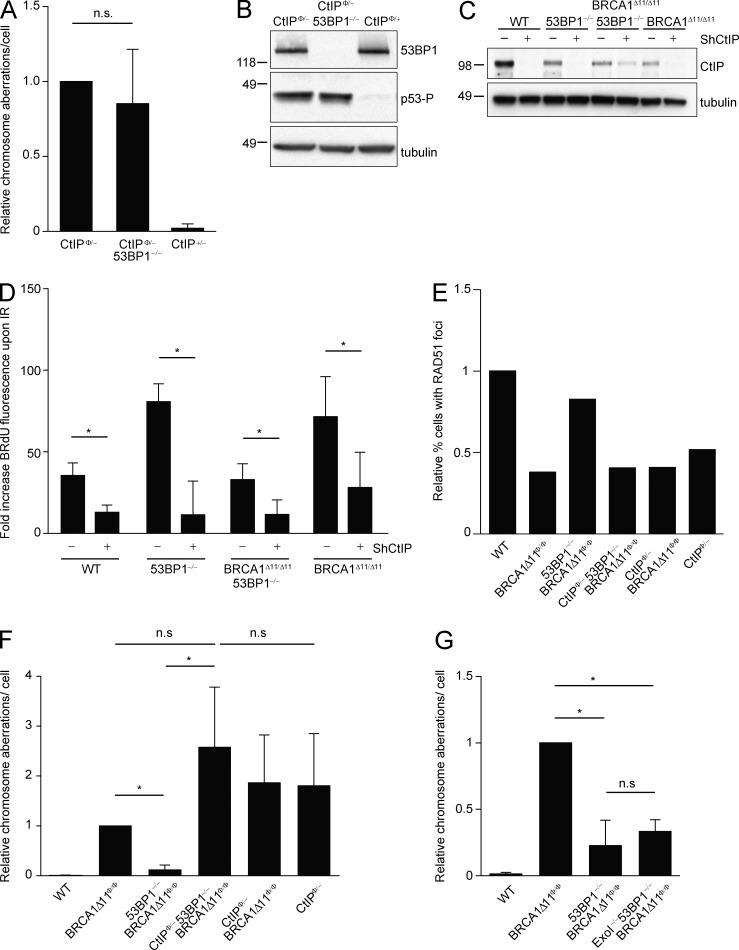
Figure 2.
Increased resection of 53BP1−/− cells is CtIP dependent. (A) Analysis of spontaneous genomic instability in metaphases from B cells isolated from mice of the indicated genotypes. Genomic instability measured in five independent experiments is normalized to levels seen in CtIP-deficient B cells (n > 200 metaphases/genotype; P = 0.4179: two-tailed paired Student’s t test). (B) Constitutive levels of p53 phosphorylation in the CtIPΦ/– and CtIPΦ/– 53BP1−/− double mutant B cells. (C) Western blot analysis showing levels of CtIP expression in MEFs infected with CtIP shRNA (shCtIP). (D) Fold increase of mean BrdU fluorescence of irradiated (30 Gy) versus unirradiated MEFs of the indicated genotypes that were either infected or not with ShCtIP. The mean and SD of three independent experiments is shown (significance tests were analyzed with one-tailed paired Student’s t test; *, P < 0.05). (E) Percentage of cells with >5 RAD51 foci after 10 Gy irradiation relative to WT (16.5% of WT cells were positive for RAD51 foci). For each experiment, >600 cells were counted. (F) Analysis of genomic instability in metaphases from B cells treated with PARPi (1 µM; 16 h; n > 200 metaphases/genotype were counted; the mean of 4 independent experiments is reported relative to BRCA1-deficient cells; significance tests were analyzed with two-tailed paired Student’s t test; *, P < 0.05; n.s., not significant). (G) Analysis of genomic instability in B cells after PARPi treatment (1 µM for 16 h). The graph shows the average number of aberrant chromosome structures per cell measured in three independent experiments relative to genome instability in BRCA1-deficient cells (n = 150 metaphases/genotype; significance tests were analyzed with two-tailed paired Student’s t test; *, P < 0.05; n.s., not significant). For each independent experiment, one mouse per genotype was used.

