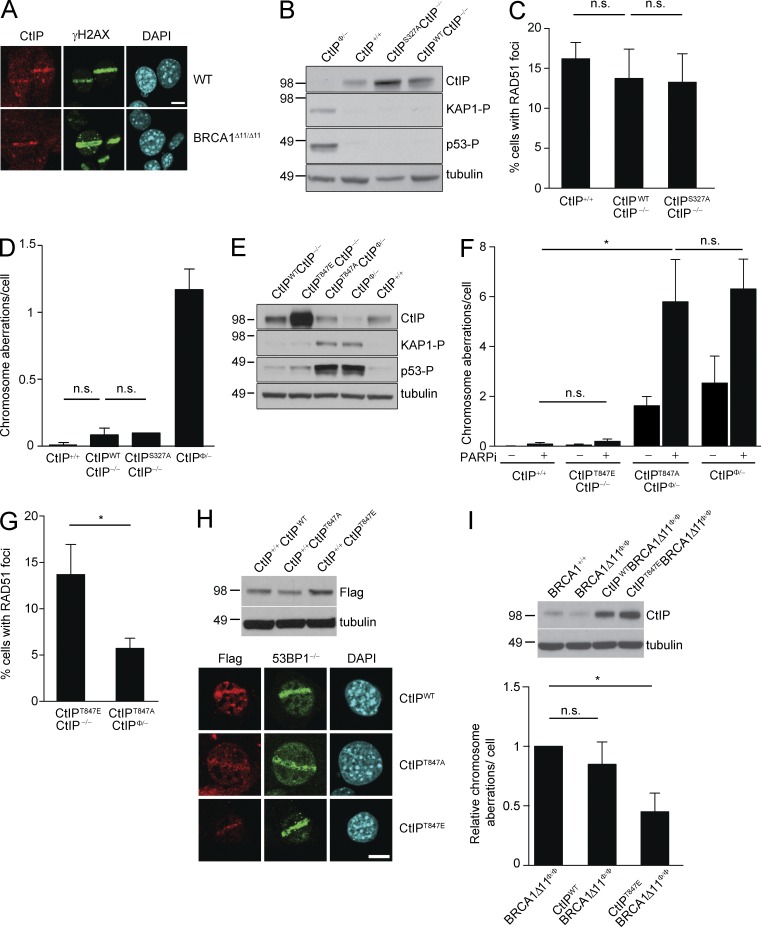
Figure 3.
CDK-dependent phosphorylation of CtIPT847 is essential for CtIP function. (A) WT and BRCA1Δ11/Δ11 MEFs were irradiated with a 364-nm laser line derived from a LSM510 microscope. After 10-min recovery, cells were processed for immunofluorescence analysis of CtIP (red) and γH2AX (green). Bar, 15 µm. (B) Western blot showing expression of transgenic CtIPWT and CtIPS327A protein and phosphorylated KAP1 and p53 in B cells. (C) Percentage of cells with >5 RAD51 foci after 10 Gy irradiation. Three independent experiments are reported. For each experiment, >600 cells were counted (significance tests were analyzed with two-tailed paired Student’s t test; *, P < 0.05; n.s., not significant). (D) Analysis of total genomic instability in metaphases from B cells isolated from mice of indicated genotypes after treatment for 16 h with 1 µM PARPi. The mean number of chromosome aberrations per cell measured in 3 independent experiments is shown (n = 250 metaphases; significance tests were analyzed with two-tailed paired Student’s t test; *, P < 0.05; n.s., not significant). (E) Levels of transgenic CtIPWT, CtIPT847E, and CtIPT847A protein expression and KAP1 and p53 phosphorylation in mutant B cells detected by Western blotting. (F) Analysis of total genomic instability in metaphases from B cells with or without PARPi treatment. Mean of three independent experiments is shown (significance tests were analyzed with two-tailed paired Student’s t test; *, P < 0.05; n.s., not significant). (G) Percentage of B cells with >5 RAD51 foci after 10 Gy IR. Three independent experiments are reported. >600 cells were counted for each genotype (P = 0.0251; two-tailed paired t test). (H) Western blot showing the level of CtIP expression in infected cells using anti-FLAG antibody (top). WT MEFs expressing FLAG-CtIPWT, FLAG-CtIPT847A, or FLAG-CtIPT847E were treated with Hoechst 33342 and irradiated with the 364-nm laser line and after 20-min recovery FLAG (red) and 53BP1 (green) were detected by immunofluorescence (bottom). Bar, 15 µm. (I) Western blot showing the levels of CtIP protein in B cells from mice of the indicated genotype (top). Genomic instability in B cells isolated from mice of the indicated genotypes, relative to total instability measured in BRCA1-deficient B cells. Cells were treated with 1 µM PARPi for 16 h (bottom). Three independent experiments are reported (significance tests were analyzed with two-tailed paired Student’s t test; *, P < 0.05; n.s., not significant). For each independent experiment, one mouse per genotype was used.

