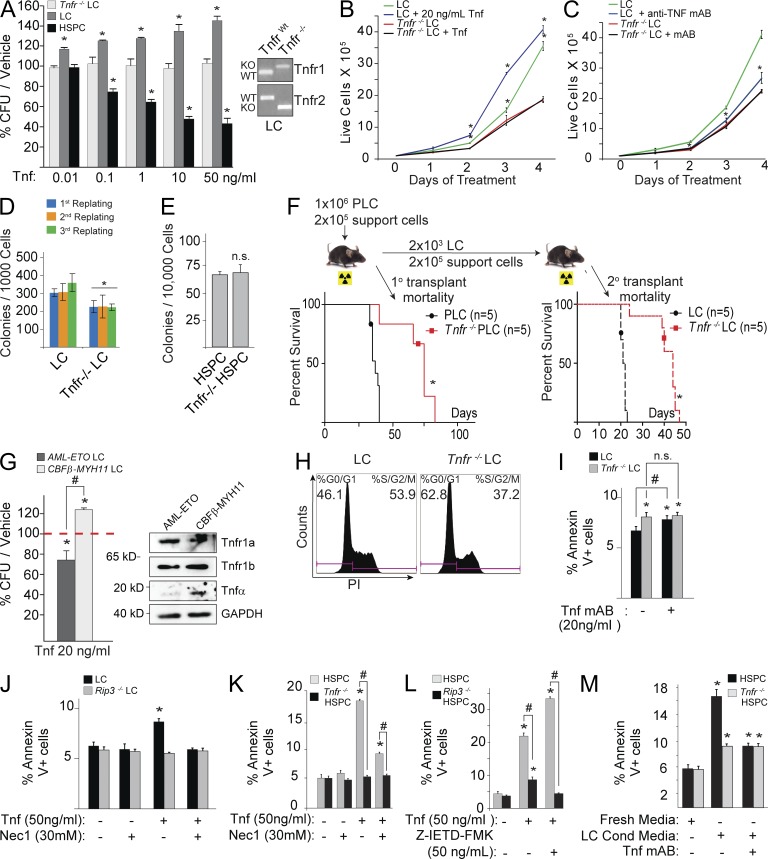
Figure 2.
Tnf promotes LC growth but represses HSPC growth in vitro. (A) CFU from MA9-LC and HSPC treated with indicated doses of Tnf. The numbers of CFU of each type of cell in Tnf-treated groups were normalized to the CFU number in vehicle-treated group. Genotype results are shown for LC and Tnfr−/− LC. (B and C) LC and Tnfr−/− LC were treated with 20 ng/ml Tnf (B) or 20 µg/ml anti-Tnf mAb (C) in suspension culture. Growth curves of LC were examined by counting the number of live cells daily by trypan blue exclusion. (D) Serial colony-forming ability was compared between LC and Tnfr−/− LC. (E) CFU/20,000 cells shown for Tnfr−/− HSPC and HSPC. (F) Leukemogenic capacity of LC and Tnfr−/− LC was compared by in vivo transplantation. (G) CFUs from AML-ETO and CBFβ-MYH11–transduced murine LCs were treated with Tnf. Expression of Tnf and its receptors are shown by Western blot analysis. (H) Cell cycle was compared between LC and Tnfr−/− LC. (I) Tnfr−/− LC and LC were cultured overnight in the presence of anti-Tnf mAb. Cell death was measured by Annexin V/PI assay. Significance is measured relative to vehicle control in LC, unless otherwise noted. (J) LCs were treated with Tnf with or without Nec-1 overnight, and cell death was measured by Annexin V/PI. Rip3−/− LCs were used as necroptosis-negative controls. (K) HSPC and Tnfr−/− HSPC were cultured in medium with or without exogenous Tnf. Nec1 was used to block necroptosis. (L) HSPCs from WT (Rip3 WT) and Rip3−/− mice were cultured with or without Tnf. Z-IETD-FMK was used to inhibit Caspase 8 activity. Cell death was examined 24 h after Tnf treatment. (M) Tnf secreted by MA9-LC is sufficient to induce cell death in HSPC. WT and Tnfr−/− HSPCs were incubated in fresh medium or 1:5 conditioned/fresh medium from LC culture and treated with or without anti-Tnf mAb. * indicates P < 0.05 when compared with vehicle treated control (A–C and G–M) or WT control (D–F) as determined by Student’s t test two-tailed analysis. # indicates P < 0.05 significant difference when compared with indicated conditions. Values shown are mean ± SD analysis from three independent trials, unless otherwise notated. Western blot in G and readout for H are representative results from three independent trials.

