Figure 2.

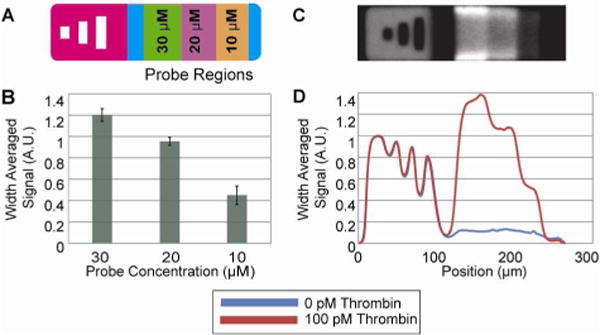
Evaluation of probe concentration. (A) Schematic of particle bearing the barcode “123” and three distinct probe regions with different concentrations of HTDQ probe. The blue regions before and after the probes are blank regions containing only monomer. (B) Bar graph showing the fluorescent signal produced from the three different probe regions from a sandwich assay. Data represent the average of 5 particles. (C) Static image of a particle incubated with 100 pM thrombin and labeled with PAb-T. Regions bearing higher concentrations of probe in the monomer clearly show higher fluorescent signal. (D) Static scan showing the average of 5 particles incubated with 100 pM thrombin (red) and 0 pM thrombin (blue).
