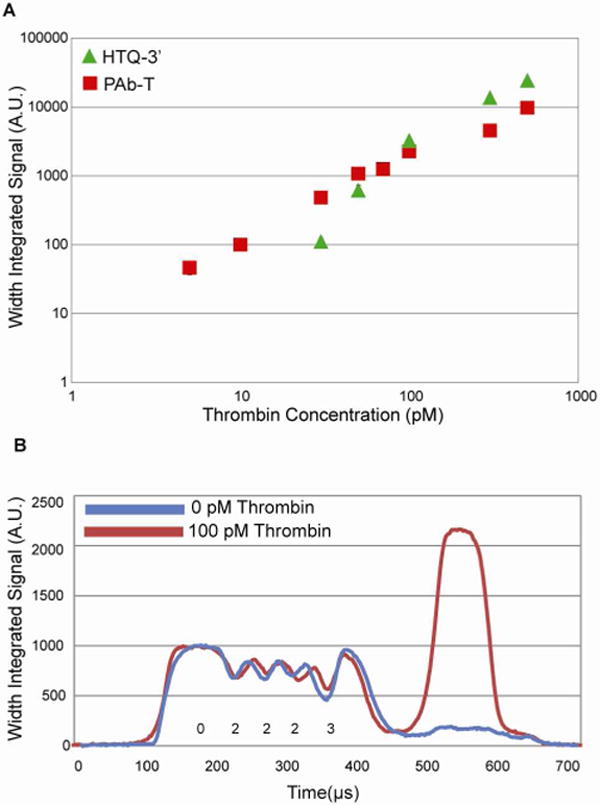
Figure 5.

Detection capability of HTQ-3′ and PAb-T. (A) Calibration curves for HTQ-3′ (green triangle) and PAb-T (red square). Data was generated using flow-through scanning of particles after sandwich assay. Signal is linear over a range of 2 logs for HTQ-3′ and a range of 3 logs for PAb-T. CVs are provided in Table 1. (B) Particle profiles derived from scanner data. Sample scans are shown for target incubations with 100 pM thrombin (red) and 0 pM thrombin (blue). In both cases, particles were labeled with 10 nM PAb-T.
