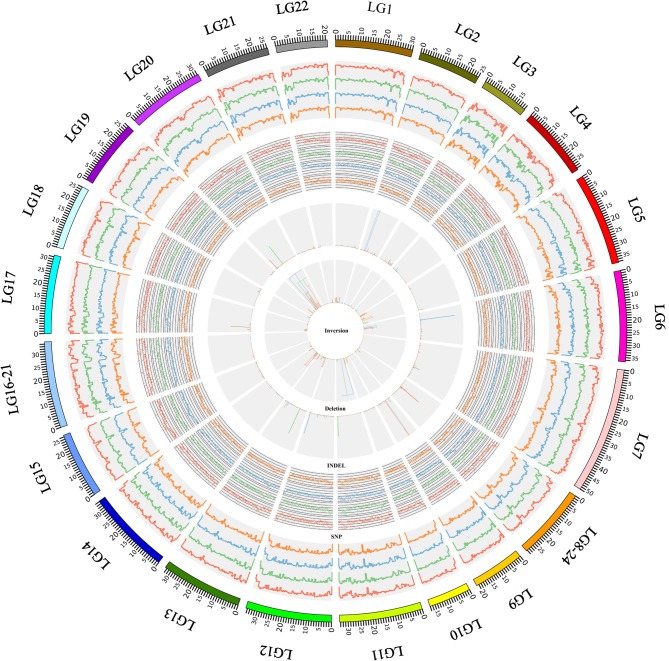
Figure 1.
The distribution of genomic variation in the African cichlid genomes. This figure shows an overview of the SNPs, indels, inversions, and deletions that were identified in this study. The most outer ring showed the chromosomal ideogram in a clockwise orientation. The panels from outside to inside summarized the SNP density, indel density, and the location of the inversions and deletions, which were identified in the N. brichardi (in red), A. burtoni (in green), P. nyererei (in blue), and M. zebra (in orange) genomes. The SNP and indel densities were scanned using a 50 kb sliding window. The histograms in the inversion and deletion panels represent the position of the inversion and deletion and the widths of the histograms show the size of the variations. The results were visualized using Circos (Krzywinski et al., 2009).

