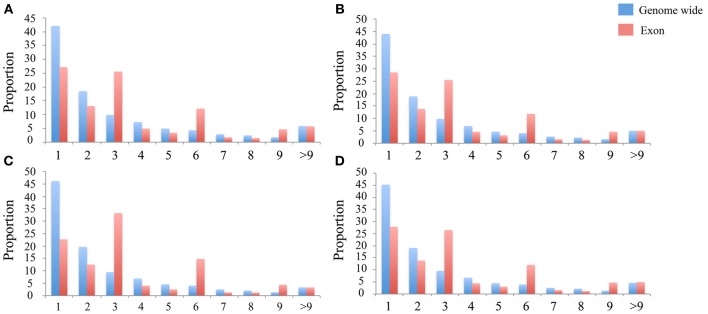
Figure 3.

Indel length distribution. The Y-axis is the proportion of the indels in the exon region (Red) and genome wide (Blue). The X-axis is binned by the length of the indel. (A–D) present in the indel length distribution in the N. brichardi, A. burtoni, P. nyererei, and M. zebra genomes.
