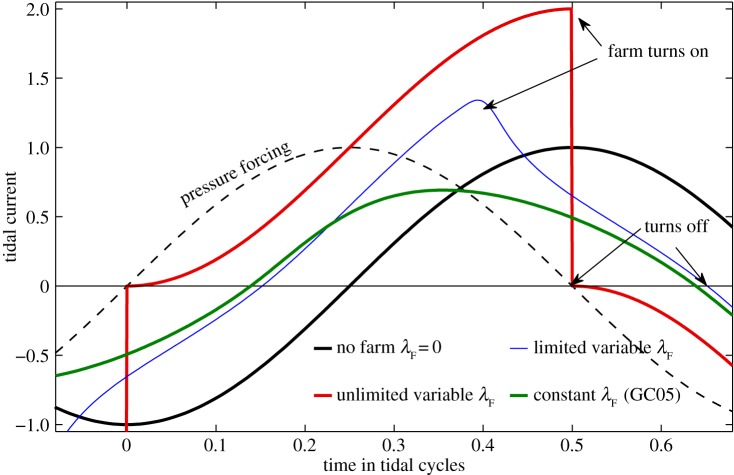
Figure 2.
Velocity solutions to (2.2) which maximize average power (2.3) for λ0=0. Red curve is the intuitively derived extreme case solution for , blue curve is the optimal solution to (2.2) for and the green curve is GC05's optimal solution for constant λF. Velocities are relative to the peak flow in the channel when there is no farm.

