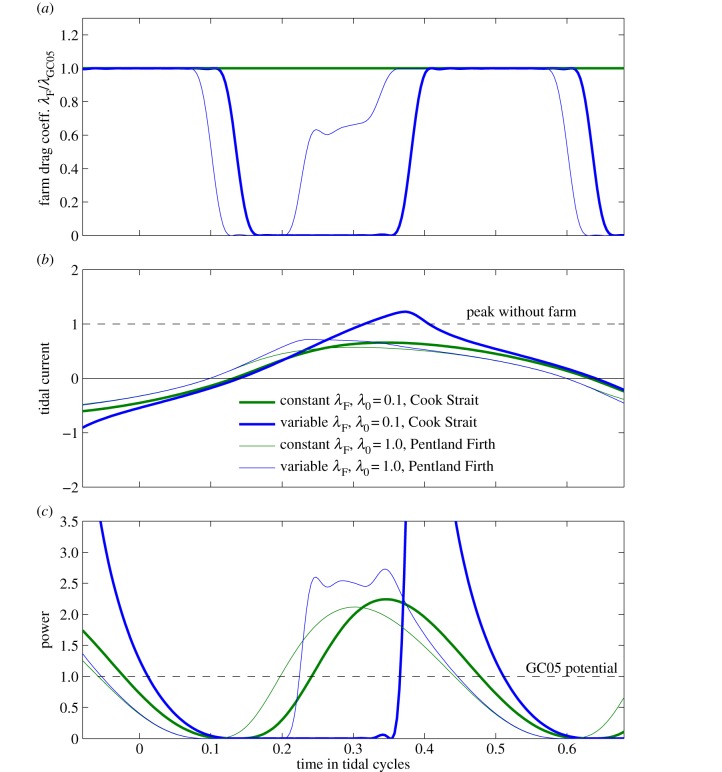
Figure 3.
Limited variable drag coefficient and constant drag coefficient farms which maximize average farm output (2.3) in two of the example channels. Blue lines are for optimal variable drag coefficient with and green lines are for GC05's optimal constant drag coefficient. Thick lines are for Cook Strait, and thin lines are for the Pentland Firth. (a) Optimal variable farm drag coefficient λoptF(t′) relative to λGC05F for each channel. (b) Tidal current relative to the peak flow in the undisturbed channel. (c) Instantaneous power production of the farm relative to GC05's potential for each channel, .

