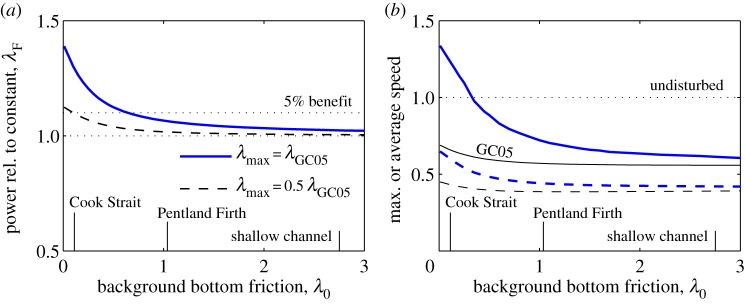
Figure 4.

The effect of increasing bottom friction on power production by farm with optimal variable drag coefficient. Labels show λ0 for the three example channels. (a) Average power relative to a constant drag coefficient farm with given ; (b) velocities relative to the velocity in channel with no farm at given λ0. Solid lines show peak flow and the dashed lines the flow speed averaged over a tidal cycle. (Online version in colour.)
