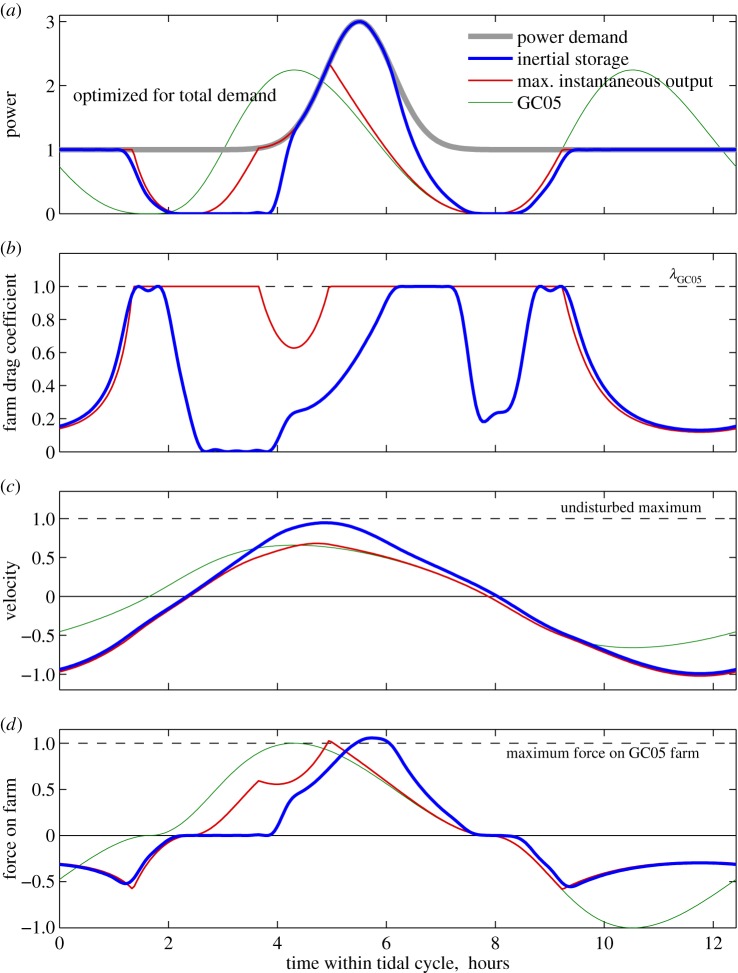
Figure 5.
Example of a farm in the Cook Strait example channel optimized to meet the total demand (4.1) given by the grey curve with . The peak in the Gaussian demand curve is at 5.5 h. (a) Power and demand relative to . An inertial storage farm meets 68% of total demand and 90% of peak demand, whereas a MIOF meets 63% of total demand but only 40% of peak demand. (b) Optimized variable farm drag coefficient relative to λGC05F. (c) Velocity along the channel relative to velocity when there is no farm. (d) Total force on the farms relative to the maximum force on a GC05 farm.

