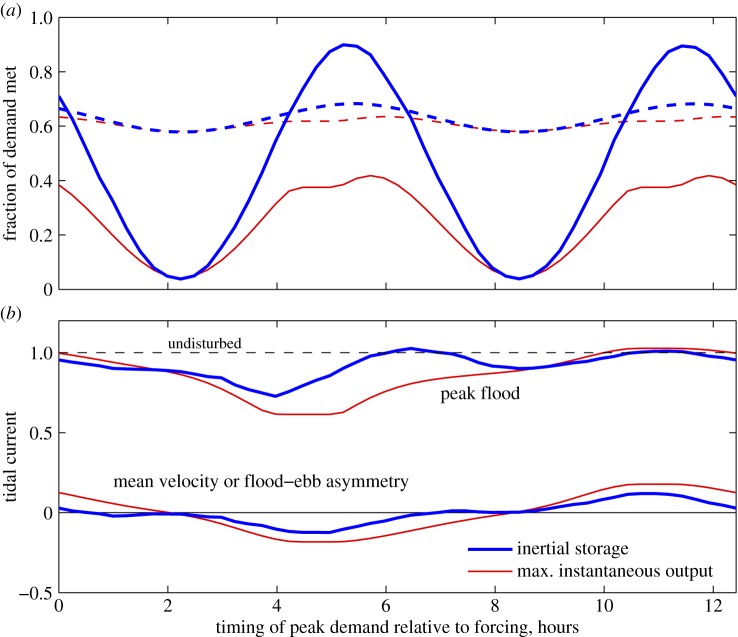
Figure 6.
Example of the effect of sliding the timing of peak demand relative to the tidal forcing for a farm in the Cook Strait, with λ0=0.1. The farm is optimized to meet the total demand with . (a) Solid lines are fraction of peak demand met, and dashed lines are the fraction of total demand met. (b) Tidal current along the channel. Upper curves are the peak positive flood flow. Lower curves give the mean velocity over a tidal cycle, a measure of the flood/ebb asymmetry which results from power extraction within a tidal cycle. Thick blue lines are inertial storage farm and thin red lines the MIOF. (Online version in colour.)

