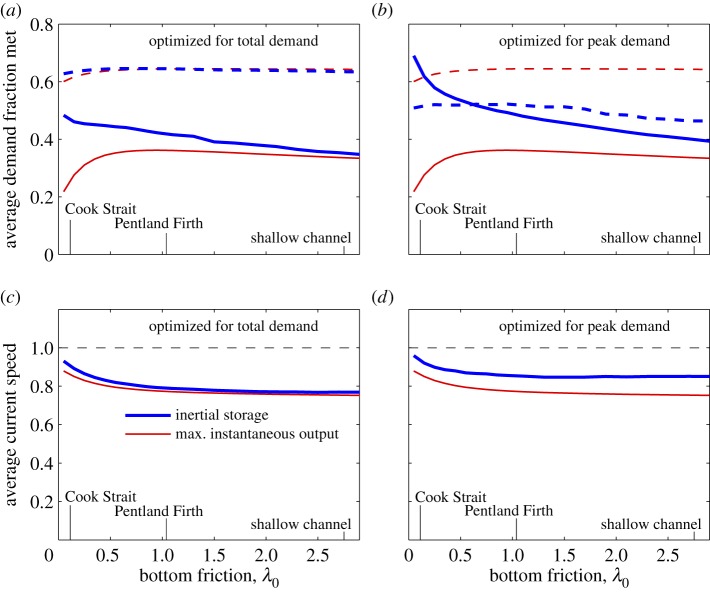
Figure 7.
Fraction of demand met averaged over 14 days for inertial storage farms and MIOF farms in a range of channel sizes with . Dashed lines give fraction of total demand met and solid lines give the fraction of peak demand met. (a) Farms optimized to meet total demand (4.1). (b) Farms optimized to meet peak demand (4.2) are able to trade meeting more peak demand for meeting less of the total demand. (c,d) Average current speed, relative to average current speed in the undisturbed channel, for farms optimized to meet total demand and peak demand, respectively. Thick blue lines are inertial storage farm and thin red lines the MIOF. (Online version in colour.)

