
Figure 8.
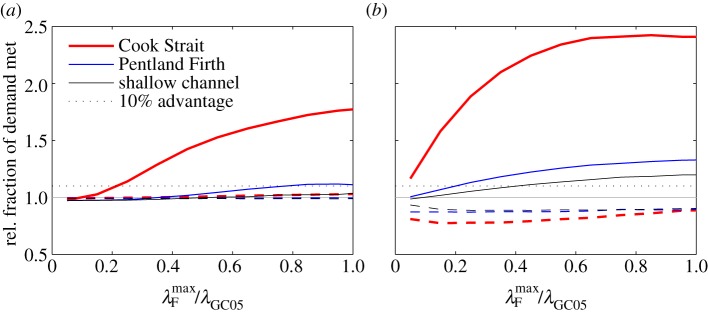
Effect of varying on the fraction of demand met by an inertial storage farm averaged over 14 days relative to a MIOF in the three example channels. Solid lines are ratio of the fraction of peak demand met by an inertial storage farm to the fraction met by a MIOF with the same . Dashed lines give the ratio for the fractions of total demand met. Horizontal dotted line indicates ratio giving an inertial storage farm a 10% advantage over a MIOF. (a) Farms optimized to meet total demand (4.1). (b) Farms optimized to meet peak demand (4.2). (Online version in colour.)