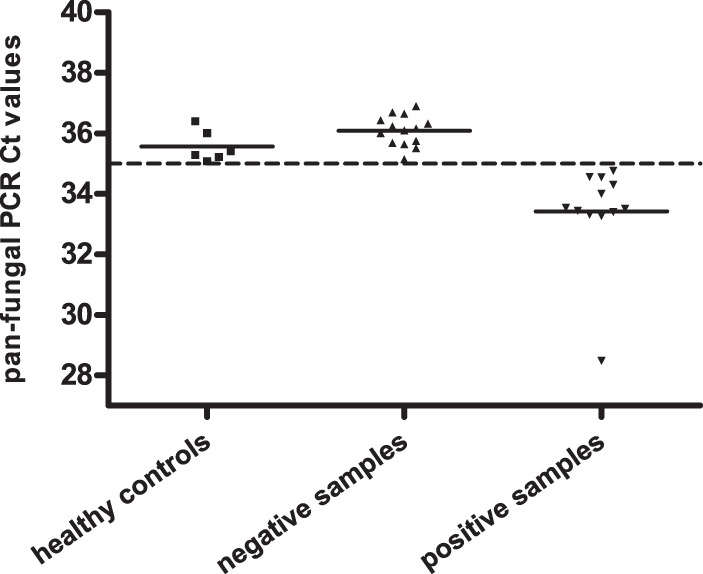
FIG 1.

Panfungal real-time PCR CT value distributions in samples from healthy controls, negative samples, and positive samples. The dashed line represents the CT cutoff of 35, and the solid lines denote the mean CT values of healthy controls and patients. All healthy controls were negative, with a mean CT of 35.6, and the mean CT was 36.1 for negative samples tested in this study. In contrast, 11 samples from 10 patients were panfungal PCR positive, with a mean CT of 33.4, significantly lower than that of healthy controls (P < 0.0001). The number of positive samples decreased to 7 when a more rigorous CT cutoff of 34 was applied.
