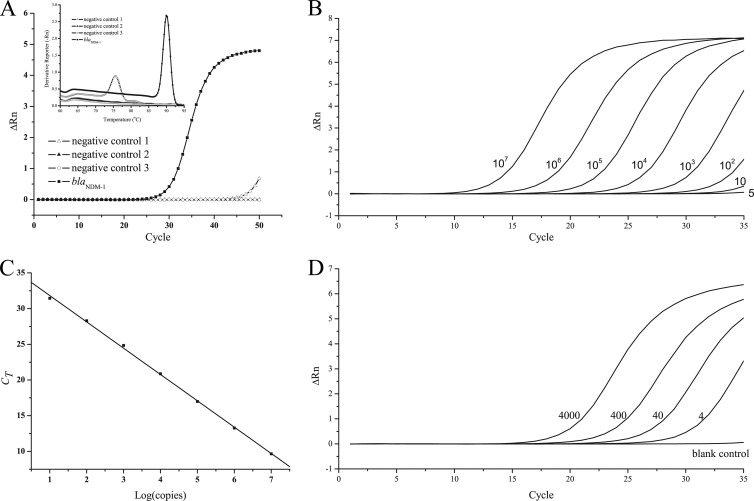
FIG 2.
LF-qPCR assay of blaNDM-1. (A) Amplification curves and melting curves (inset) of the negative controls and blaNDM-1 (103 copies/reaction mixture volume). (B) Amplification curves of dilutions of the plasmid (copies/reaction mixture volume) extracted from a blaNDM-1-containing A. baumannii strain (A. baumannii 65). (C) Corresponding standard curve of the LF-qPCR assay. (D) Amplification curves of water samples spiked with different concentrations (CFU/reaction mixture volume) of A. baumannii 65. All experiments were repeated three times to determine the sensitivity and linearity of LF-qPCR. ΔRn, baseline-corrected normalized reporter.

