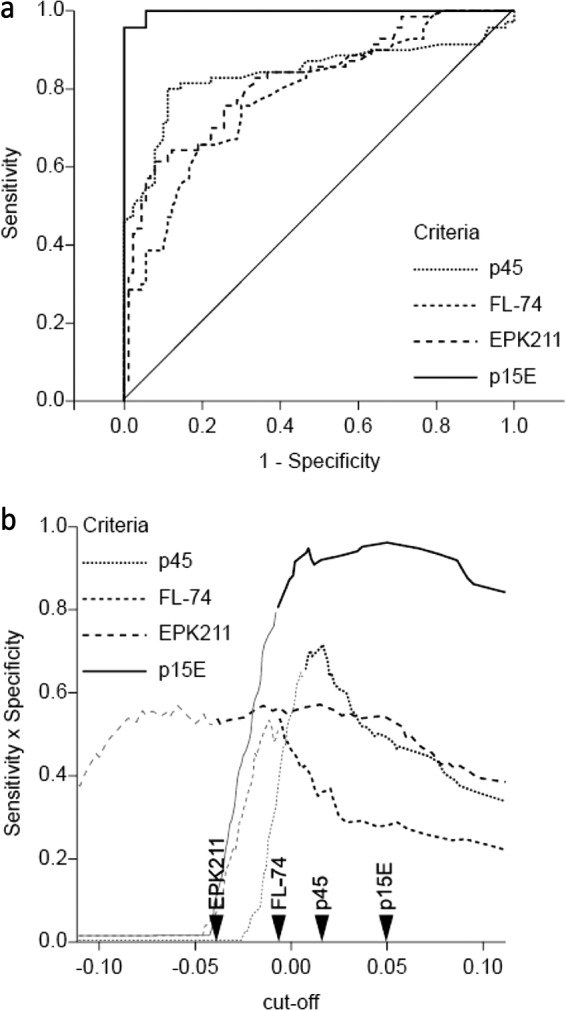
FIG 2.

(a) Empirical provirus receiver operating characteristic (ROC) curves for the experimentally infected cats, including specific-pathogen-free (SPF) cats (n = 94) and provirus-positive (p27 positive and p27 negative) cats (n = 70). The true-positive rate (sensitivity, y axis) is plotted against the false-positive rate (1-specificity, x axis) at various cutoff points. (b) Determination of the optimal cutoff for experimentally infected cats. The sensitivity × specificity (y axis) is plotted against the cutoff (x axis). Dark lines represent specificities of ≥80%. The arrows indicate the cutoff points for each antigen.
