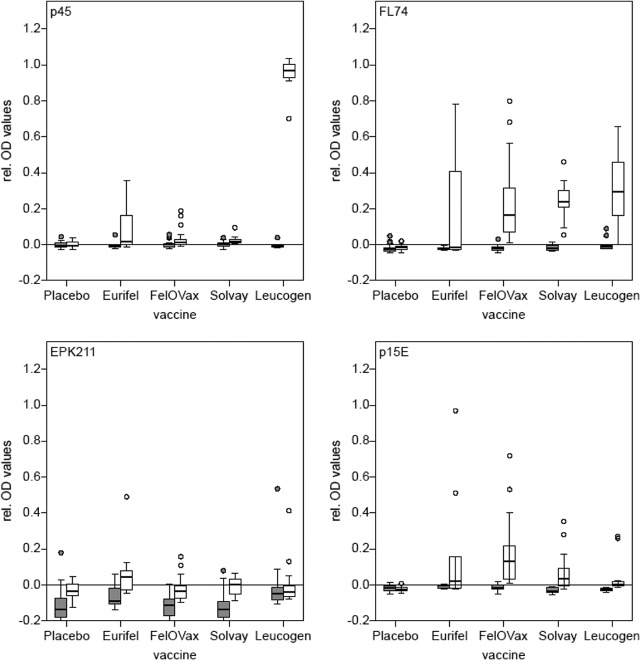
FIG 4.
Antibody response of experimentally vaccinated cats. The y axes represent the relative OD values; the x axes represent the vaccines used in the study. All four antigens were tested. The gray bars indicate 8-week-old specific-pathogen-free (SPF) cats (n = 63) before immunization; the white bars indicate the same cats (n = 63) after two immunizations and before challenge.

