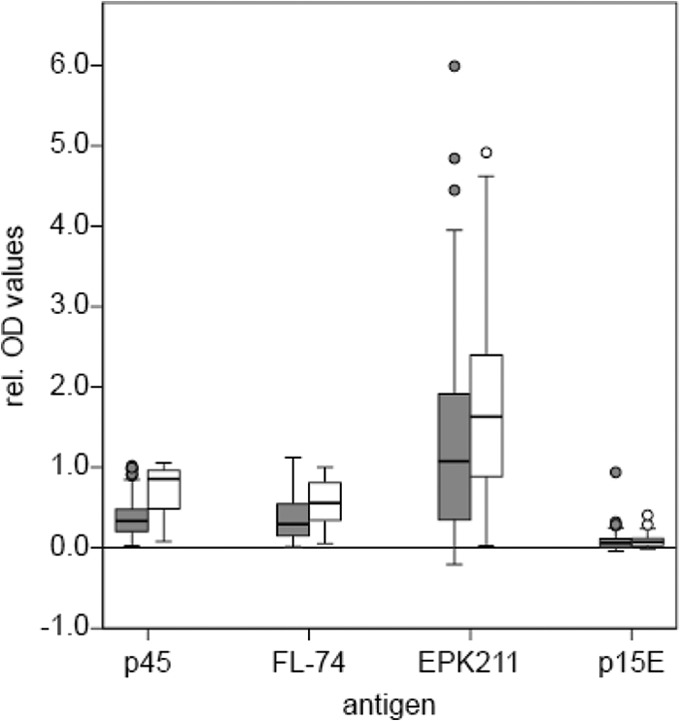
FIG 5.

Antibody response of privately owned vaccinated cats. The y axis represents the relative OD values, and the x axis represents the four antigens. The gray bars indicate cats without vaccination (n = 236), and the white bars indicate cats that were vaccinated with Leucogen (98%) (n = 50). The 8 cats found to be p27 and/or provirus positive are not included.
