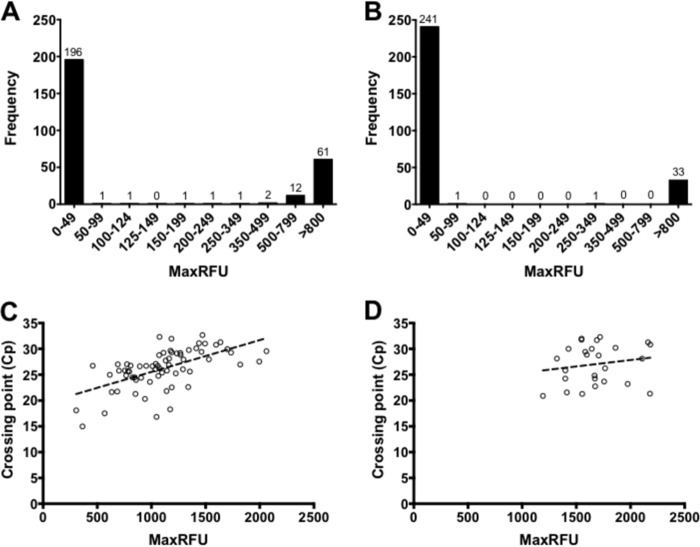
FIG 1.
Distribution of MaxRFU values for HSV-1 and HSV-2 using HSV-Qx. (A and B) Distributions of MaxRFU values are depicted for HSV-1 and HSV-2 results following the categorization provided by the manufacturer. (C and D) Lack of correlation is shown between MaxRFU and Cp values obtained using the LightCycler for HSV-1 (R2 = 0.3644) and HSV-2 (R2 = 0.0726), respectively.

