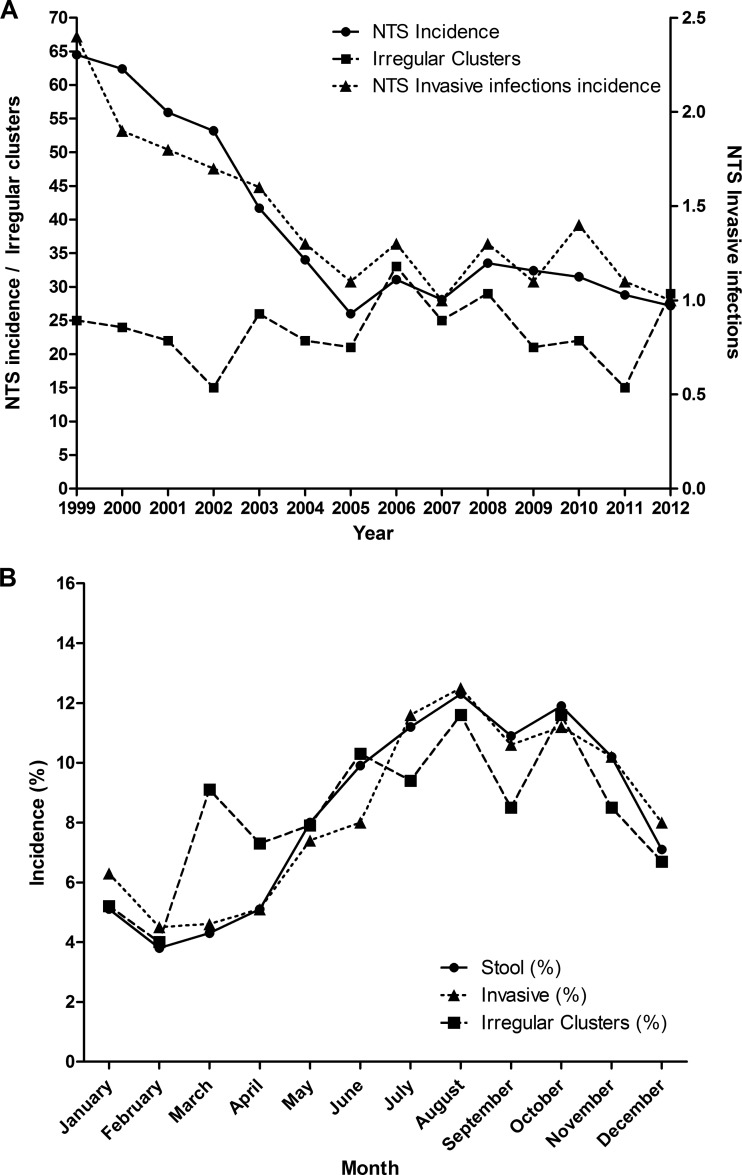
FIG 1.
(A) Annual incidence of reported NTS, invasive NTS infections, and predicted salmonellosis clusters in Israel, 1999 to 2012. The annual incidence of NTS Salmonella cases (circles and solid line) and the number of invasive NTS infections (triangles and dotted line) are shown per 100,000 population and were inferred from the laboratory-confirmed Salmonella cases received at the National Salmonella Reference Center. The yearly number of clusters (squares and broken line) was predicted by the Farrington statistical surveillance model as described in Materials and Methods. (B) Seasonal distribution of salmonellosis clusters, 1999 to 2012, and invasive and stool infections with reported NTS Salmonella in Israel, 1995 to 2012.

