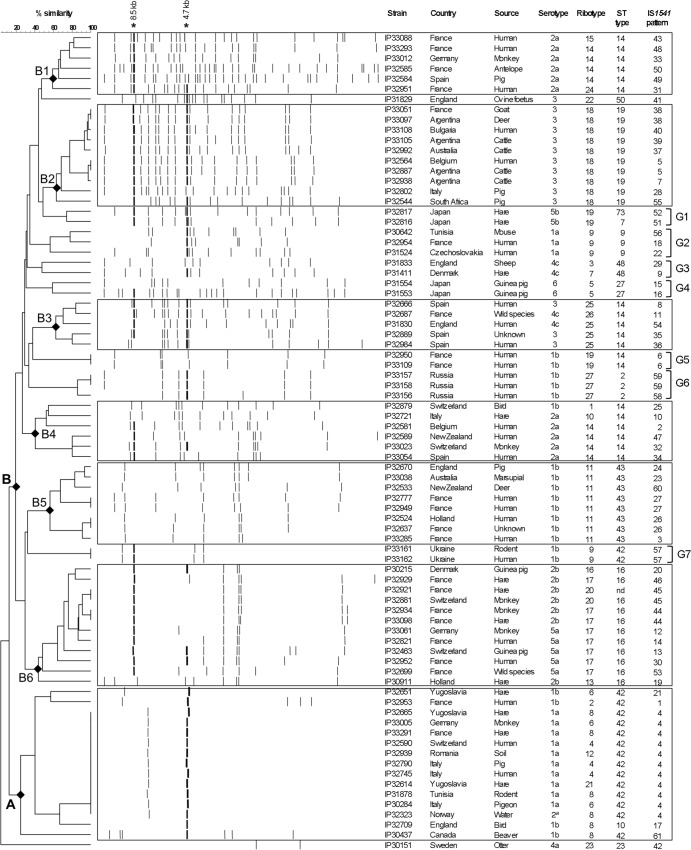
FIG 3.
Dendrogram generated from the IS1541-RFLP patterns of the 80 Y. pseudotuberculosis strains studied, using the UPGMA clustering analysis with the BioNumerics software. A position tolerance of 1.8% was chosen. Stars indicate hybridizing fragments of ca. 8.5 kb and 4.7 kb that were present in the majority of strains. Rectangles indicate clusters of strains of interest, and braces indicate groups of two or three strains with common characteristics.

