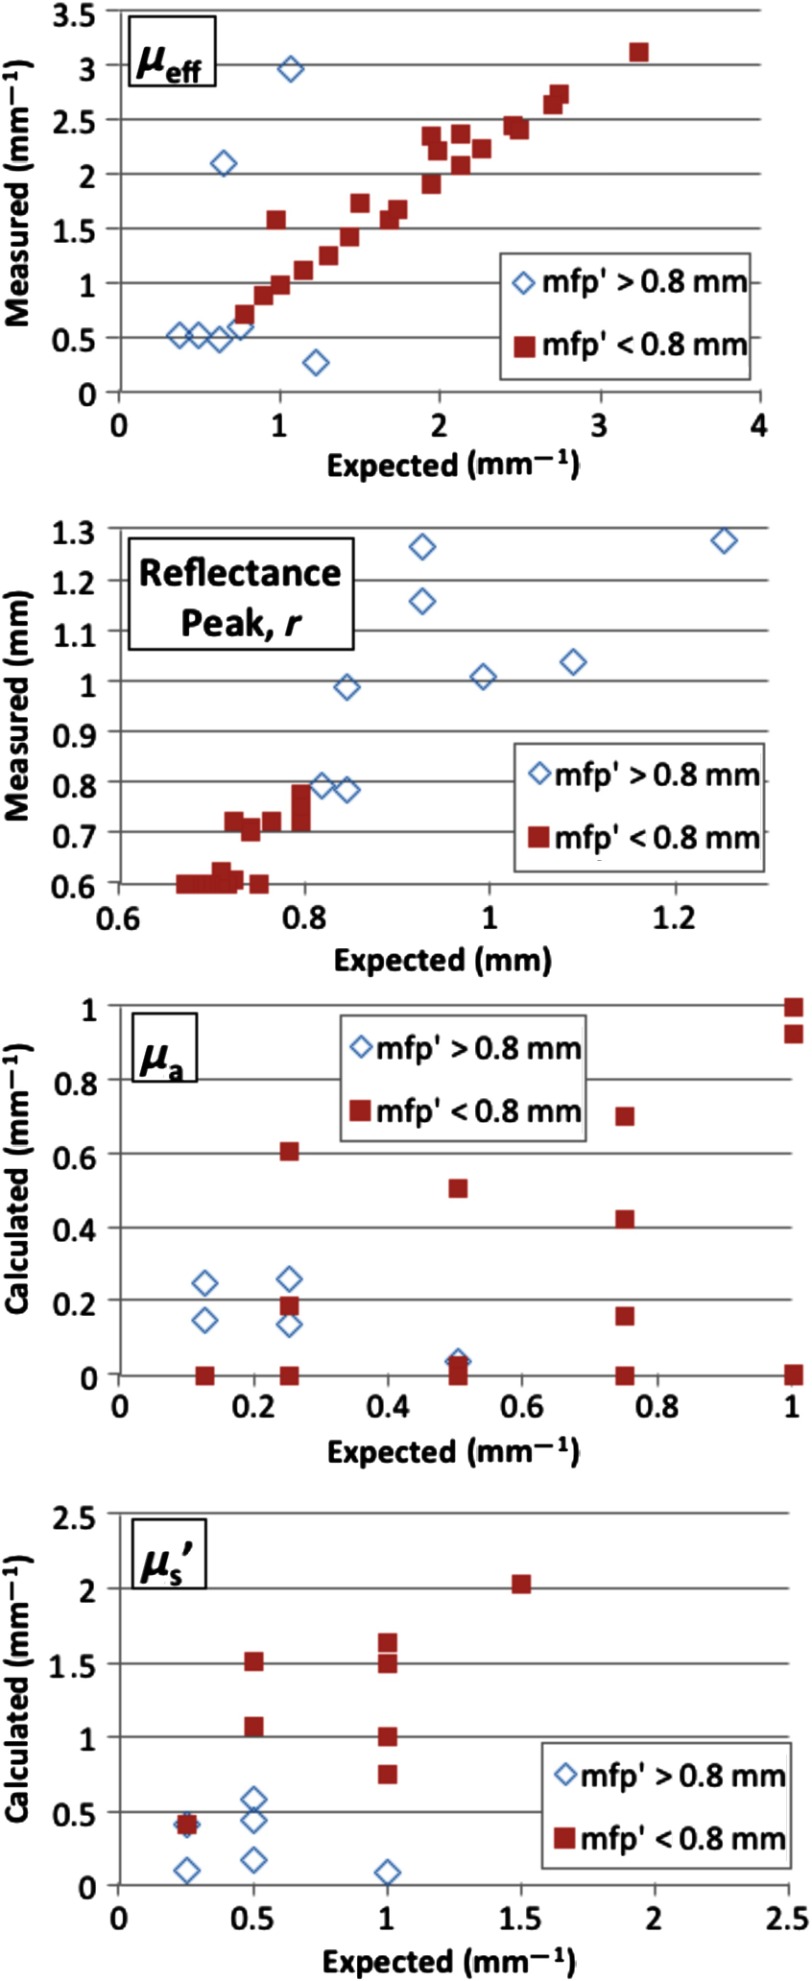
Fig. 6.
Expected versus calculated effective attenuation coefficients (), offsets, and absorption () and reduced scattering coefficients () for FRED-simulated tissue optical phantoms and the full OIR endoscope. Measurements of phantoms with mean free paths (outside design limits) are marked with diamonds, while measurements for those with an are marked by squares.

