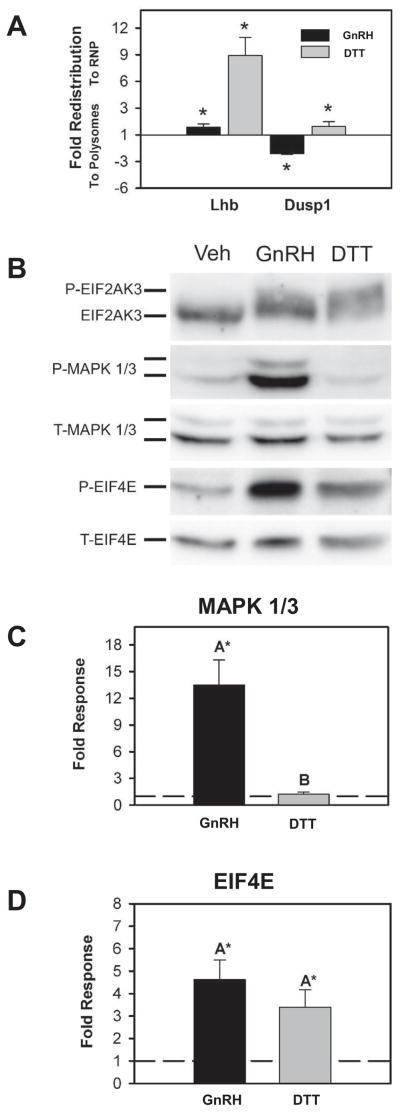
Figure 2. Activation of the UPR does not explain polyribosome enrichment of Dusp1 mRNA.
A) Summary of Lhb and Dusp1 enrichment in RNP and polyribosome fractions of cytoplasmic extracts from vehicle or 10nM GnRH-treated LβT2 cells with or without pretreatment with 2 mM DTT. DTT causes enrichment of both Lhb and Dusp1 mRNA to the RNP fraction, but GnRH causes RNP enrichment of Lhb mRNA and polyribosomal enrichment of Dusp1 mRNA. Asterisks indicate significant fold change from untreated samples in four independent experiments as determined by Student’s t-test. B) An example Western blot analysis of signaling proteins isolated from Vehicle (Veh), GnRH and DTT treated LβT2 cells using antibodies directed against EIF2AK3, phosphorylated MAPK1/3, total MAPK 1/3, phosphorylated EIF4E, and total EIF4E. Proteins were visualized by chemiluminescent imaging and resulting images used in quantification of individual proteins as below. Images are presented in inverted grayscale. C) Summary of Western blot quantification of phosphor- and total MAPK1/3 from 4 replicate experiments showing increased phospho-MAPK1/3 to total MAPK 1/3 ratio due to GnRH, but not DTT treatment of LβT2 cells. Protein levels were determined by chemiluminescent imaging and quantification. Phosphorylated to total ratios of protein were normalized to untreated levels and plotted. GnRH, but not DTT, increases MAPK1/3 phosphorylation. D) Summary of EIF4E phosphorylation in response to GnRH and DTT treatment of LβT2 cells as above. Ratios of phospho- to total- EIF4E were determined and normalized to untreated controls in five independent experiments. Both GnRH and DTT increase EIF4E phosphorylation to a similar degree. In both C and D dashed lines represent control ratio of phospho-MAPK1/3 to total MAPK 1/3 or phospho-EIF4E to total-EIF4E normalized to one. Asterisks indicate significant difference from untreated control as determined by Student’s t test and groups with different letters are significantly different from each other as determined by two-sample t test.

