Figure 1.
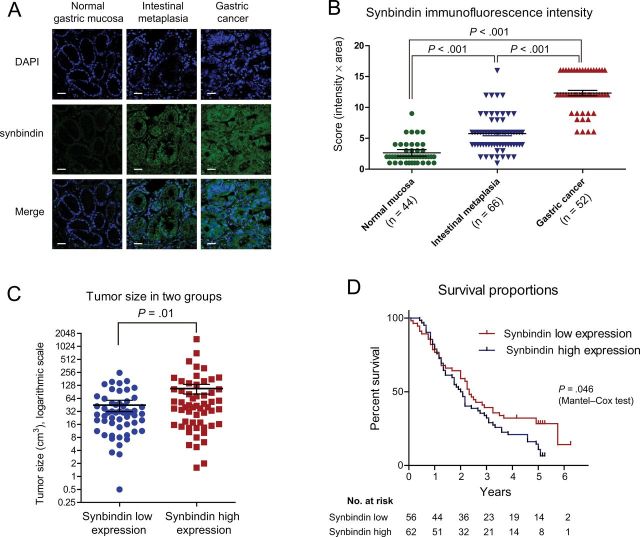
Relationship between synbindin expression and outcome of gastric cancers. A) Immunofluorescence of synbindin in normal gastric mucosa, intestinal metaplastic mucosa, or gastric cancer tissues. Paraffin-embedded tissue sections were stained using specific antibodies for synbindin in green. Cell nucleus was stained with 4’,6-diamidino-2-phenylindole (DAPI) in blue. Scale bars indicate 50 μm. Sybindin protein expression level was scored based on both staining intensity and positive frequency. B) Statistical analysis of synbindin expression in normal, precancerous, and cancerous gastric tissues. The staining intensity was scored as 1 (negative), 2 (weakly stained), 3 (moderately positive), and 4 (strongly positive). The fraction of positive cells was graded as 1 (less than 1/4), 2 (1/4 to 1/2), 3 (1/2 to 3/4), and 4 (3/4 to all). The overall score was calculated by multiplying the intensity score and the fraction score, producing a total range of 1 to 16. The bars represent mean scores with 95% confidence interval (CI). The differences between each two groups were statistically significant (P < .001, two-sided Mann–Whitney test). C) Statistical analysis on the size of gastric cancers in synbindin low expression and high expression groups. The average tumor size in two groups was compared using two-sided Mann–Whitney test (P = .01). The bars represent mean value with 95% confidence interval. D) The Mantel–Cox test indicated statistically significantly shorter survival of patients in the synbindin high expression group than the low expression group (hazard ratio = 1.51; 95% CI = 1.01 to 2.27; P = .046). The number of patients at risk in each group is given below the graphs.

