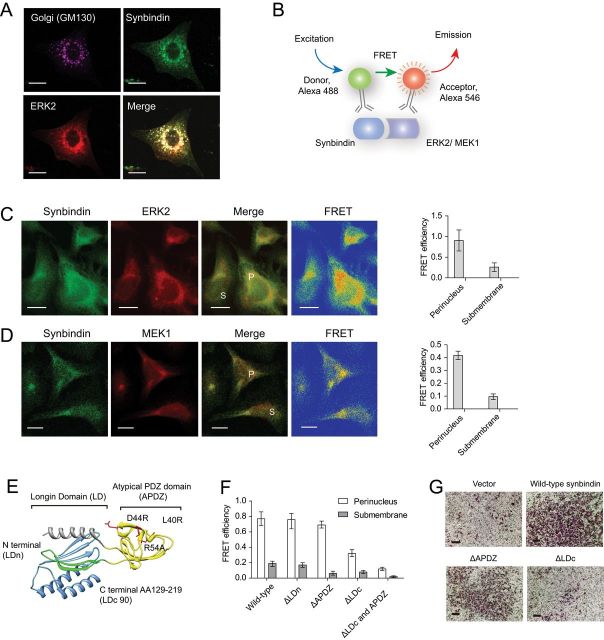
Figure 4.
Mapping the structural domain relevant to the effects of synbindin. A) Immunofluorescent staining of endogenous synbindin, ERK2, and GM130 in MGC-803 cells. The GM130 protein is specifically localized in the Golgi apparatus, and it strongly colocalized with synbindin and ERK2. Scale bars indicate 10 μm. B) Schematic representation for the setup of fluorescent resonance energy transfer (FRET) assay. A direct interaction of synbindin and ERK2 proteins would bring the donor and receptor fluorophors close enough and lead to highly efficient FRET. C) FRET between endogenous synbindin and ERK2. Scale bars indicate 10 μm. The efficiency of FRET is shown in the rainbow map, wherein the red and orange colors indicate strong FRET. The perinuclear region is marked by “P”, and the submembrane section is labeld with “S”. The bar plot on the right indicates mean FRET efficiency with 95% confidence interval. D) The FRET efficiency between endogenous synbindin and MEK1 is shown in the same format as with ERK2. E) Crystal structure of synbindin protein (pdb entry 2ZMV) labeled with mutant positions. The Longin domain is divided by the atypical PDZ domain (APDZ, in yellow) into N terminal (LDn, in green) and C terminal domains (LDc). The extreme C terminal region of Longin domain (LDc90, cloned into yeast two-hybrid vector) is shown in blue. F) FRET between ERK2 and different synbindin mutants. The bar plots indicate average FRET efficiency with 95% confidence interval. Although the truncation mutants ΔLD and ΔAPDZ did not affect the synbindin-ERK2 interaction, deletion of the LDc domain decreased FRET between synbindin and ERK2. G) Different mutants of synbindin were ectopically expressed in MGC803 cells, and Transwell assay was performed to determine their invasiveness. Deletion of the LDc but not the APDZ domain decreased the proinvasion effect of synbindin. Scale bars indicate 100 μm.

