
Figure 5.
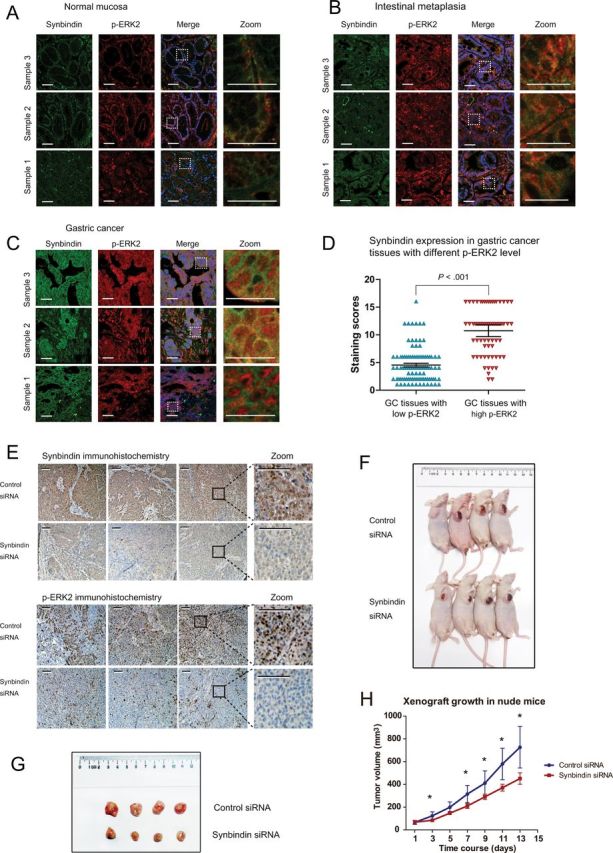
In vivo effects of synbindin on ERK2 regulation. Paraffin-embedded tissue sections from normal gastric mucosa (A), mucosa with intestinal metaplasia (B), or gastric cancer (C) were stained using specific antibodies for synbindin in green and for ERK2 in red. Cell nucleus was stained with 4’,6-diamidino-2-phenylindole (DAPI) in blue. The dashed lines indicate the region that is enlarged in the panels on the right. Scale bars indicate 50 μm. D) Statistical analysis of synbindin expression levels in human gastric cancers with different ERK2 activation status. The score for each case (blue or red marks), together with the mean value and 95% confidence interval (CI) for different groups are plotted (P < .001, two-sided Mann–Whitney test). The scoring method for evaluating synbindin expression level based on immunofluorescent staining intensity can be found in the Methods section. E) Mice were injected subcutaneously with human gastric cancer MGC-803 cells to establish xenograft model, and specific small interfering RNAs (siRNAs) for synbindin were introduced to tumor cells by in vivo jetPEI nanoparticles. Immunohistochemical staining suggested that knockdown of synbindin (upper panels) decreased p-REK2 level in xenografts (lower panels). Scale bars indicate 100 μm. F) Mice carrying xenograft tumors treated with synbindin siRNAs or control siRNAs at the last time point (13 days after first injection). G) Comparison of excised tumors. H) The growth curves of xenograft tumors in different groups. Data represent mean with 95% confidence interval, and exact values are shown in Supplementary Table 3 (available online). Knockdown of synbindin statistically significantly decreased tumor growth as compared with the control group (last time point: 451.2mm3, 95% CI = 328.3 to 574.1 vs 726.1mm3, 95% CI = 544.2 to 908.2; P = .01, two-sided Student t test).