. 2014 May 9;3:e02105. doi: 10.7554/eLife.02105

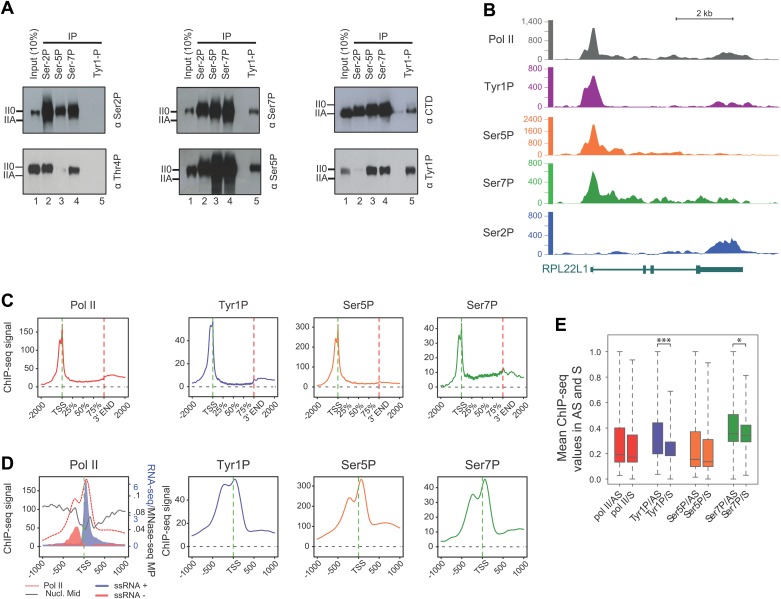
Figure 2. CTD Tyrosine 1 is phosphorylated mainly at TSS and is dominant in antisense transcription.

(A) Co-immunoprecipitation with specific CTD isoforms in Raji B-cells reveals Tyr1P (3D12) association with Ser5P and Ser7P but not with Ser2P and Thr4P. (B) ChIP-seq example illustrating Tyr1P (3D12) association around the promoter of RPL22L1 gene. (C) Composite average profiling of ChIP-seq data at coding genes locations for Pol II (1433 genes), Tyr1P (3D12, 2462 genes), Ser5P (1464 genes), and Ser7P (2186 genes) in Raji B-cells and based on selections described in Figure 2—figure supplement 1B. Less stringent selections with more genes gave equivalent profiling (Figure 2—figure supplement 4A). (D) Profiling of Pol II, Tyr1P (3D12), Ser5P, Ser7P, nucleosomes midpoint and short strand specific RNAs (ssRNAs) around TSS locations with same selections described in (C). (E) Boxplots on 3201 genes without outliers showing mean levels of Pol II (2986 genes), Tyr1P (2964 genes), Ser5P (2909 genes), and Ser7P (2948 genes) ChIP-seq signal on regions representing each transcription orientation. The p-values (parametric two sided paired t test) of the difference of AS vs S signal are Pol II = 0.5, Tyr1p=3.4 × 10⁻¹⁵, Ser5p=0.6, Ser7p=3.5 × 10⁻².

DOI: http://dx.doi.org/10.7554/eLife.02105.006

Figure 2.

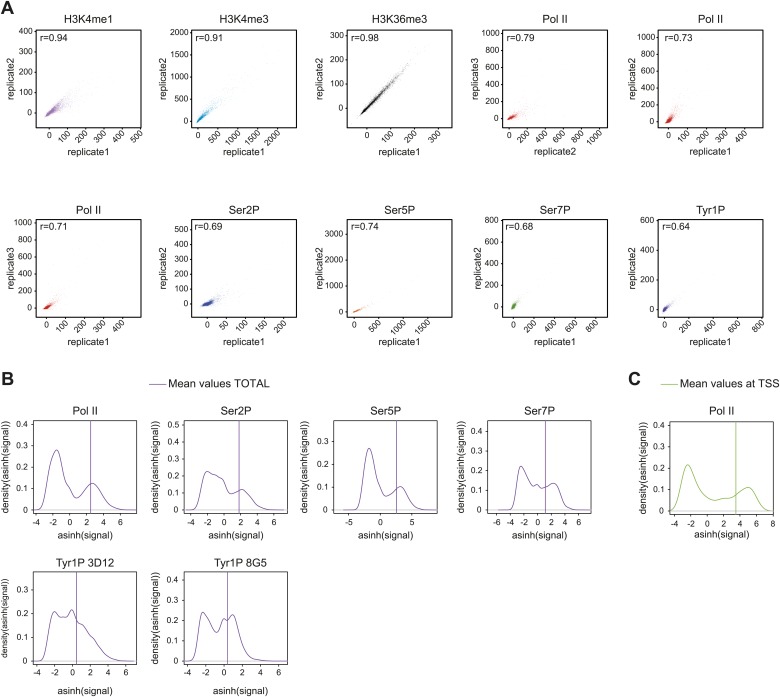
Figure 2—figure supplement 1. Reproducibility of ChIP-seq experiments and selection of relevant signals used for analyses.

Figure 2—figure supplement 1.

(A) Correlation plots of biological replicates (for all but H3K36me3 i.e., a technical replicate) of ChIP-seq experiments used in this study at gene locations (‘Materials and methods–Correlation of biological replicates and cross-correlation’). Spearman correlation coefficient is indicated on the top left of the plots. (B) Distribution and threshold of background-subtracted signal used for profiling of significantly bound gene (Total, i.e., whole genic regions) in Figure 2, Figure 2—figure supplement 5A, and Figure 2—figure supplement 7C. The mean values used for distribution were computed on [TSS-1000 bp:TES+2000 bp] (TSS: transcription start site; TES: transcription end site). Note that the thresholds were set to the mean of the second Gaussian of the distribution (‘Materials and methods–Gene selection and average binding profiles’). Numbers of genes selected for Pol II, Ser2P, Ser5P, Ser7P, Tyr1P 3D12, and Tyr1P 8G5 are 1521, 1536, 1543, 2382, 2652, and 2608, respectively. (C) Distribution and threshold of Pol II significantly bound promoters (TSS) as in (B). The selection is used in Figure 3, Figure 3—figure supplement 1, and Figure 3—figure supplement 2. 2044 genes were selected based on their mean values on TSS −/+ 500 bp.

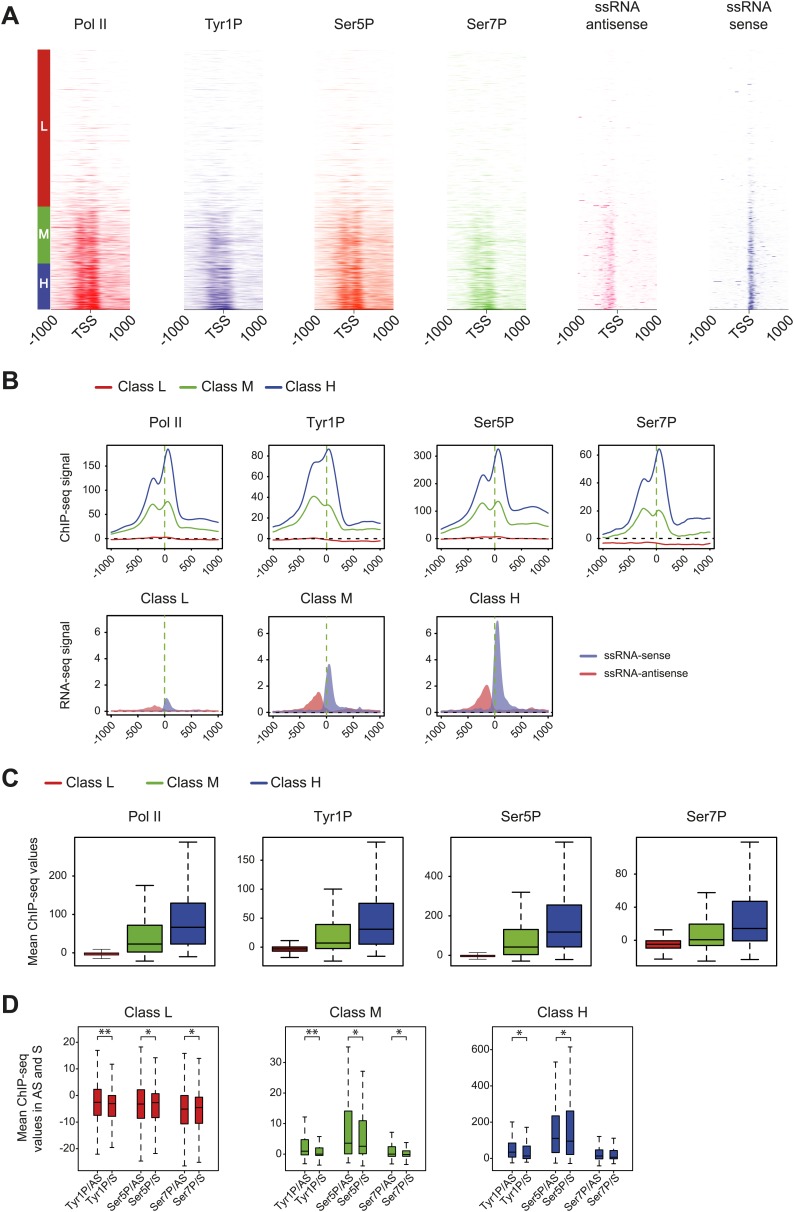
Figure 2—figure supplement 2. Pol II and CTD PTMs correlate positively with expression.

Figure 2—figure supplement 2.

Based on microarray expression data, three groups of genes with low (L, 3414 genes), medium (M, 1238 genes), and high (H, 1007 genes) expression were used to profile Pol II isoforms and short ssRNA at promoters. (A) Heatmaps of signal densities for the three defined groups. (B) Average profiles of Pol II phospho-isoforms and ssRNA at the three defined groups. (C) Boxplots of the mean values retrieved at TSS −/+ 500 bp in the three classes for Pol II (3095, 1169, 957 genes), Tyr1P (3159, 1150, 958 genes), Ser5P (3072, 1157, 956 genes), and Ser7P (3184, 1130, 942 genes). (D) Boxplot of regions representing each transcription orientation as in Figure 2E for each class divided by Pol II binding values. p-value (parametric two sided paired t test) are respectively: 2.3 × 10⁻¹³; 5 × 10⁻⁴; 6 × 10⁻³ (low), 2.4 × 10⁻¹³; 6 × 10⁻³; 2 × 10⁻⁴ (medium), 7 × 10⁻⁶; 0.02; 0.8 (high). Represented number of genes are 3175, 3126, 3074, 3051, 3123, 3134 (low); 1154, 1079, 1154, 1125, 1139, 1084 (medium); 955, 930, 941, 941, 935, 913 (high).

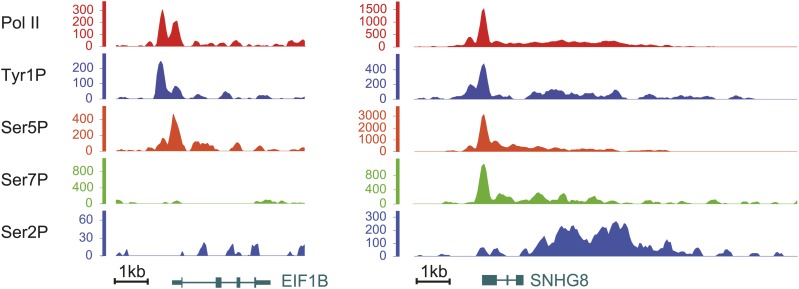
Figure 2—figure supplement 3. Examples of Tyr1P binding patterns at genic locations.

Figure 2—figure supplement 3.

EIF1B and SNHG8 are mainly bound by Tyr1P (3D12) at TSS as for RPL22L1 gene of Figure 2B.

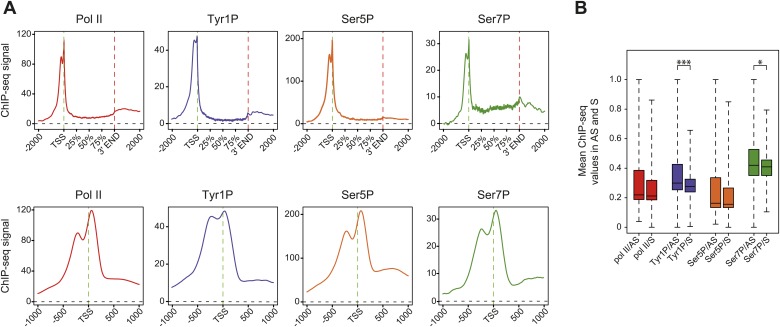
Figure 2—figure supplement 4. Average profiling of Pol II and phospho-isoforms at genic and promoter locations using wide relaxed threshold selections.

Figure 2—figure supplement 4.

(A) Composite and TSS focused average profiling of ChIP-seq data as in Figure 2C,D, for a selection threshold of 0 as described in Figure 2—figure supplement 1B, at coding genes locations for Pol II (2714 genes), Tyr1P (3D12, 2987 genes), Ser5P (2697 genes), and Ser7P (3002 genes) in Raji B-cells. (B) Boxplots on 4749 genes as in Figure 2E for the less stringent selection showing mean levels of Pol II, Tyr1P, Ser5P, and Ser7P ChIP-seq signal on regions representing each transcription orientation. The p-values (parametric two sided paired t test) of the difference of AS vs S signal are Pol II = 0.2, Tyr1p=3.5 × 10⁻¹⁶, Ser5p=0.2, Ser7p=0.03. Boxplots do not show outliers for Pol II (3933 genes), Tyr1P (3897 genes), Ser5P (3920 genes), and Ser7P (3878 genes).

Figure 2—figure supplement 5. Ser2P average profile at genic locations and examples of Tyr1P signal at promoter locations.

Figure 2—figure supplement 5.

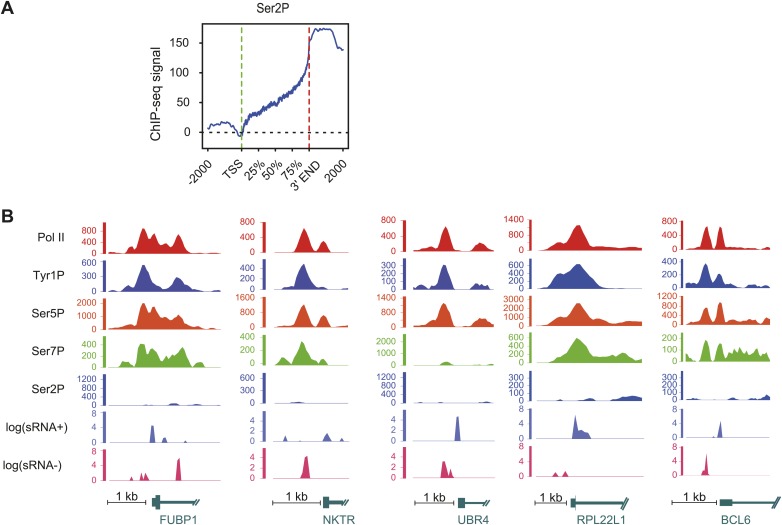
(A) Ser2P average profile on 1415 genes selected on mean values distribution shown in Figure 2—figure supplement 1B and represented as for Figure 2C. (B) Examples of Tyr1P (and other isoforms, short ssRNAs) at promoters of 5 coding genes. These genes show a dominance of Tyr1P (3D12) signal upstream (AS direction) relatively to downstream TSSs and as compared to Pol II and isoforms.

Figure 2—figure supplement 6. Tyr1P presents a specific pattern of phosphorylation along genes compared to Pol II.

Figure 2—figure supplement 6.

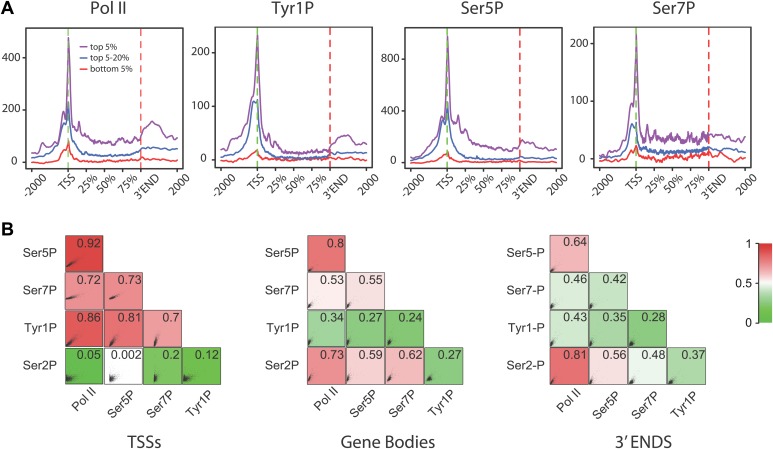
(A) Genome-wide profiling of Pol II (N20) and CTD isoforms (as in Figure 2) for different classes of binding levels indicate a distribution of Tyr1P more prominent at promoters vs gene bodies as compared to Pol II and Ser7P, but comparable to that of Ser5P. The indicated signal rank of the values is over an area encompassing TSS, GB, and 3′ ends of genes as indicated in the ‘Materials and methods–Gene selection and average binding profiles’. Note that more Tyr1P signal is found at 3′ ends as compared to Ser5P. (B) Spearman correlation plots of significantly enriched areas for Pol II and phospho-isoforms (genes size >2 kb) indicate that Tyr1P relates more to Pol II and early transcription marks at promoters than it does at gene bodies or 3′ends. Mean values for Spearman correlation were computed at [TSS-500 bp;TSS+500 bp], [TSS+1000 bp; 3′end-500 bp], and [3′end-500 bp; 3′end+1000 bp] (‘Materials and methods–Correlation of biological replicates and cross-correlation’).

Figure 2—figure supplement 7. Tyr1P specific antibodies with distinct peptide recognition patterns show similar genome-wide profiling at TSS.

Figure 2—figure supplement 7.

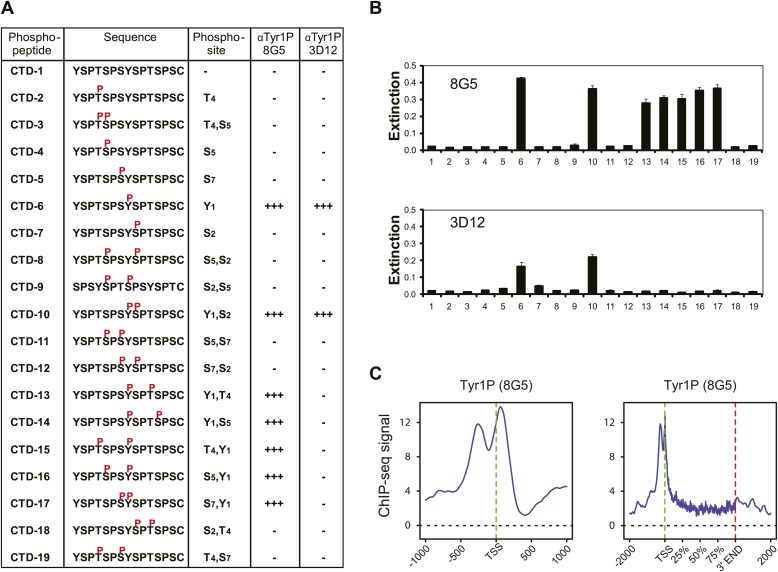
(A) CTD peptide recognition patterns of 3D12 and 8G5 Tyr1P Abs used in this study. Note that 8G5 shows a wider range of peptide recognition compared to 3D12. (B) Specificity and reactivity of mAbs were tested in ELISA experiments towards the peptides CTD-1 to -19. (C) Genome-wide profiling of ChIP-seq experiments performed with 8G5 at TSSs (left panel) or at gene body locations on 2365 genes. As for 3D12 Ab, the AS peak is over-represented when compared to Pol II.