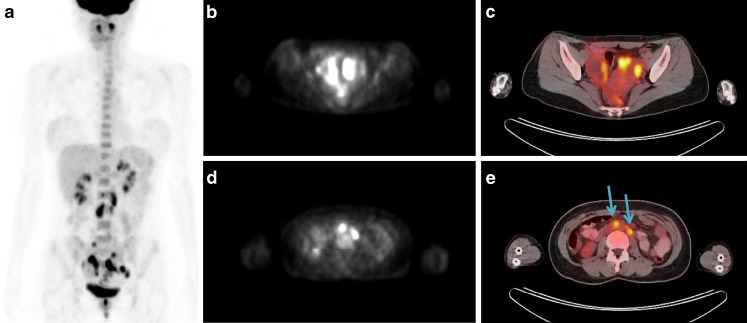
Fig. 2.
a-e Anterior maximum intensity projection (MIP) image of FDG-PET/CT (a) shows intense FDG uptake in bilateral ovaries and retroperitoneal lymph nodes. PET (b), and fusion PET/CT (c) images show high FDG uptake along the wall thickening area with maxSUV 8.4. Further, PET (d) and fusion PET/CT (e) images of the abdomen demonstrate focal intense FDG uptake in retroperiteum. Lymphadenopathies in the left paraaortic lymph nodes (maxSUV 4.1, right arrow), aortocaval lymph nodes (maxSUV 5.7, left arrow) are shown with intense FDG uptake

