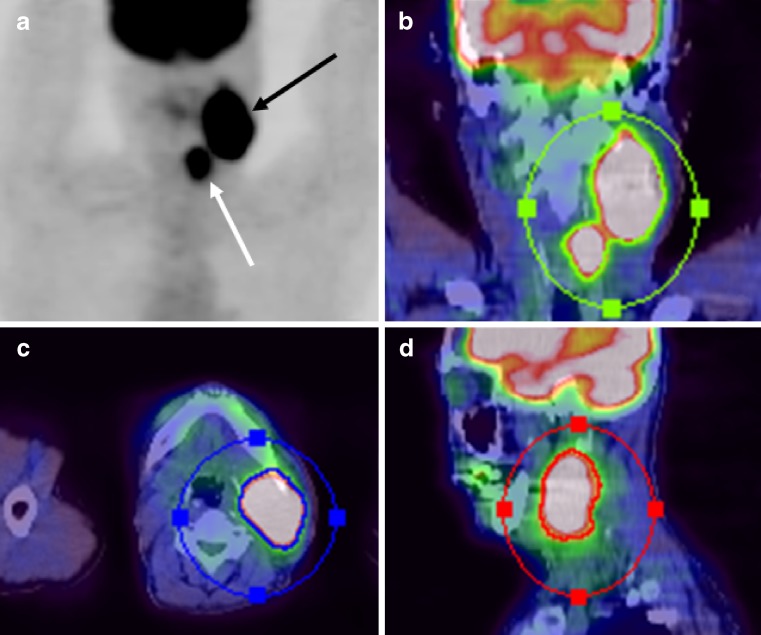
Fig. 1.
Metabolic tumor volume including primary site and regional metastatic lymphadenopathy of a 60-year-old man with hypopharyngeal squamous cell carcinoma (T2N3M0). a Maximal intensity projection (MIP) image of FDG PET/CT shows localized intense FDG uptake areas of primary site (white arrow) and metastatic lymph node (black arrow). The contour surrounding the target lesions inside the region of interest was semiautomatically produced in coronal (b), axial (c), and sagittal (d) planes from fusion images of FDG PET/CT. All voxels presenting SUV >2.5 within the contouring margin were incorporated to define the metabolic tumor volume

