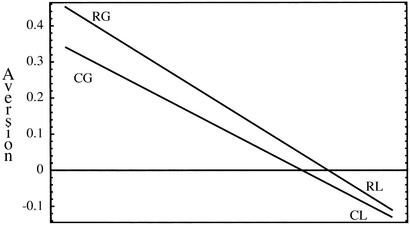
Fig 2.
The plotted points indicate the percentage difference between risk averse and risk preferring choices in the four conditions, RG, CG, RL, and CL. The figure shows that for both a Risky and Certainty comparison lottery subjects consistently show risk aversion. On the other hand, for Losses, risk aversion is less common than risk seeking for both risky and certainty reference lotteries.

