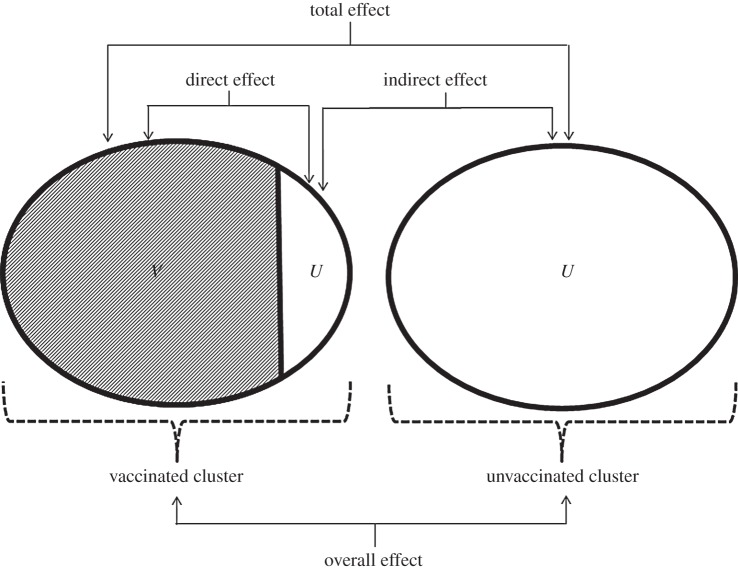
Figure 1.
Diagram showing the different types of vaccine effect detectable in a cluster trial and which vaccine groups to compare to estimate them. Within a cluster, V and U represent vaccinated and unvaccinated individuals, respectively [6]. Using this design, the different effects (direct, indirect, total and overall) can be estimated by comparing groups as indicated by the arrows. Coverage in the vaccinated cluster is <100%.

