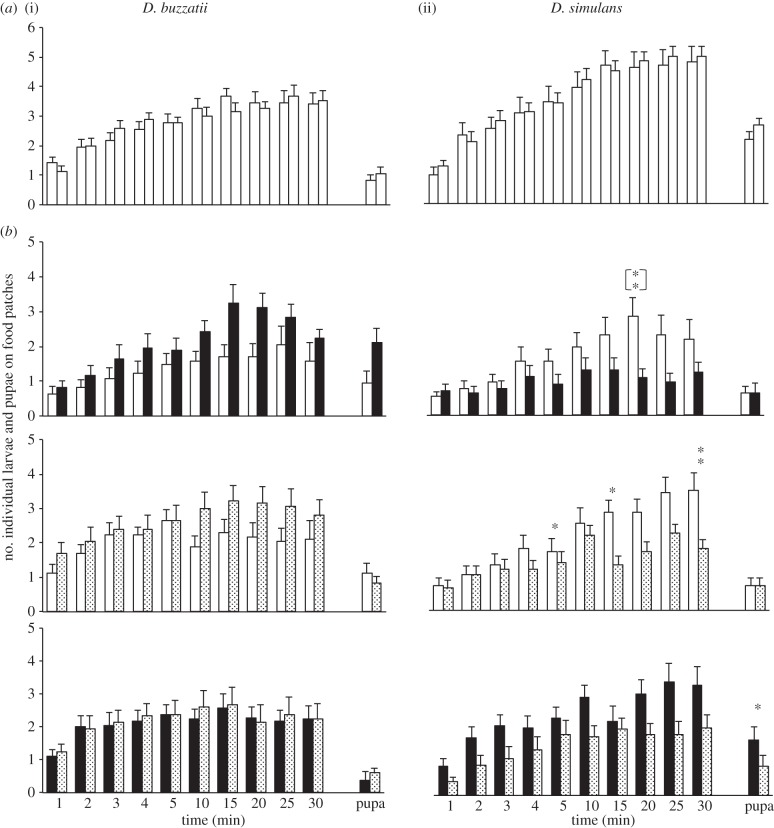
Figure 1.
Larval and pupal distribution on plain food (P-food) and food processed by larvae and adults (L + A-food). Histograms show the mean (±s.e.m.) distribution of early third instar larvae and pupae (bars on the right side on each histogram set) on two food patches. We assayed in a dual-choice test food preference in groups of 10 D. buzzatii (i) and D. simulans (ii) larvae during 30 min. The choice either consisted (a) of a pair of P-food patches (empty bars), or (b) of a P-food patch paired with a patch of L + A-food processed by D. buzzatii (filled bars) or by D. simulans (dotted bars), or with both L + A-food patches paired. The statistical difference for distribution between both food patches was tested using a Wilcoxon test (at 1, 5, 15 and 30 min for larvae): **p < 0.01; *p < 0.05; no sign: p = n.s. A significant difference was also found in D. simulans larvae tested with D. buzzatii L + A-food paired with P-food after 20 min ([**]). n = 36 for P-food, 16–18 for P- with L + A-food and 12 for paired L + A patches.

