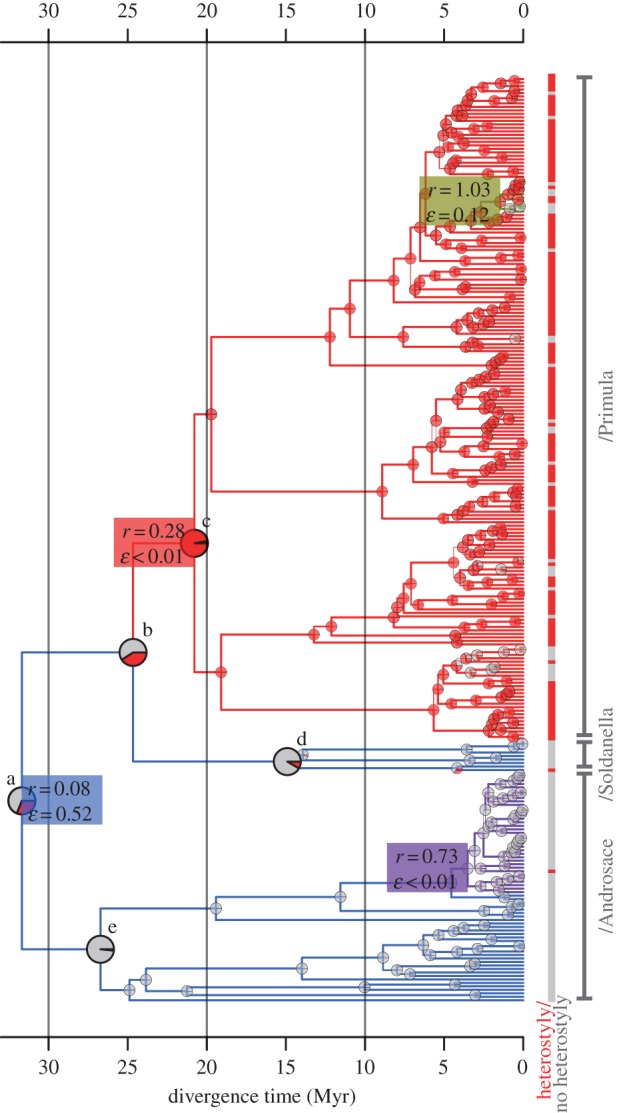
Figure 2.

Maximum clade credibility (MCC) chronogram of Primulaceae with median node heights based on the uncorrelated lognormal (UCLN) dating analysis. Pie charts at internal nodes indicate maximum-likelihood estimates of marginal ancestral states as the proportion of likelihood associated with presence (red) and absence (grey) of heterostyly (under scheme 2; electronic supplementary material, text S1), magnified for labelled nodes of interest a–e (for values and statistical support, see the electronic supplementary material, table S1). Tip states are indicated in the same colour scheme. Branch colours designate tree partitions inferred to evolve at four significantly different rates by MEDUSA, with maximum-likelihood estimates of net-diversification rate (r) and extinction fraction (ɛ) for each tree partition. The rightmost vertical bar indicates the three major clades. See the electronic supplementary material, table S1 for statistical support of ancestral character states. Branch thickness is proportional to posterior probability (for values, see the electronic supplementary material, figure S1).
