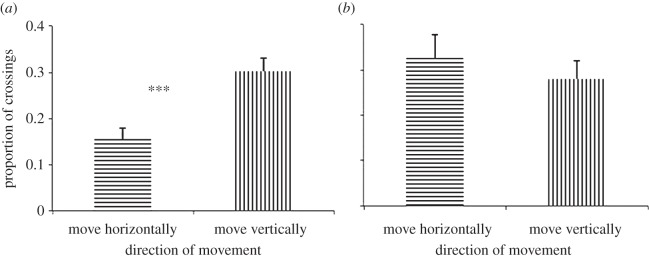
Figure 3.

Search strategy in rats and hummingbirds. The data are the mean (±s.e.) proportion of the number of units crossed in the reward's z and x–y components across the training sessions by (a) rats and (b) hummingbirds. The direction of the lines within the bars represents the direction of crossings. The asterisks represent a significance level of p < 0.001.
