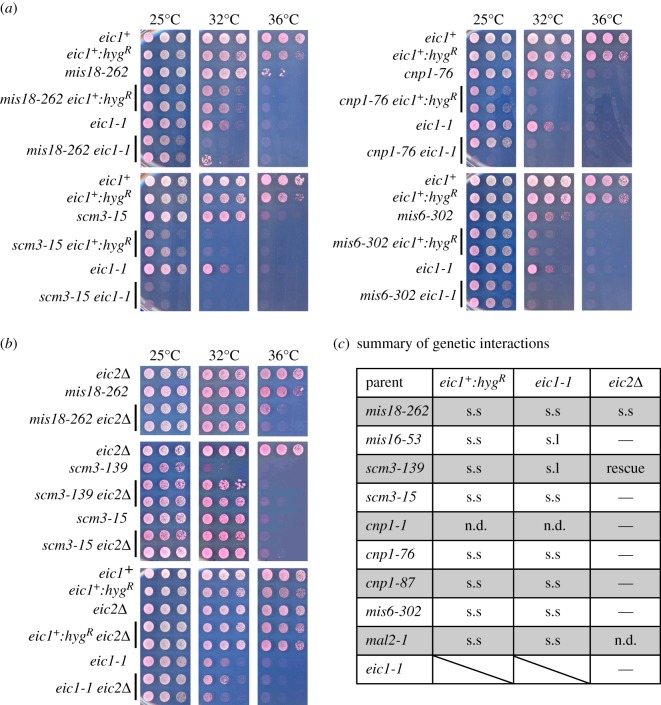
Figure 5.
Analysis of genetic interactions between eic1 or eic2 mutants and mutations in Cnp1CENP-A or Cnp1CENP-A assembly factors. (a) eic1+:hygR and eic1-1 cells display reduced growth when combined with mutations in mis18, scm3, cnp1 or mis6. (b) eic2Δ cells display genetic interactions when combined with mis18-262 and scm3-139, but not eic1-1. Five-fold serial dilutions of cells spotted on YES + Phloxine B media and incubated at the indicated temperatures; dead cells stain dark pink. (c) A tabular summary of genetic interactions analysed in this study. s.s, synthetic sick/reduced growth; s.l, synthetic lethal; n.d., not determined; —, no interaction detected.

